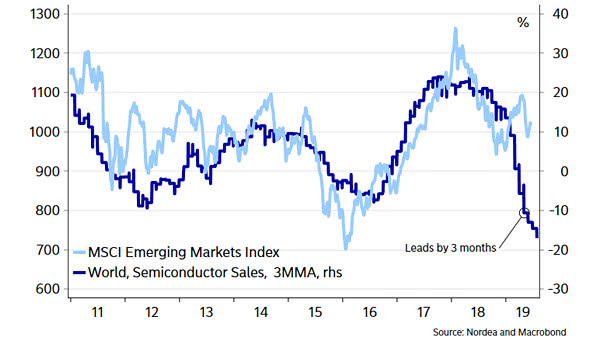
MSCI Emerging Markets Index vs. World Semiconductor Sales
MSCI Emerging Markets Index vs. World Semiconductor Sales This great chart suggests that world semiconductor sales lead the MSCI emerging markets index by 3 months. Very interesting chart before investing in emerging market equities. Country weights of the MSCI Emerging Markets Index: 33% China, 13.02% Korea, 11.35% Taiwan. Image: Nordea and Macrobond