European Stocks and MSCI World
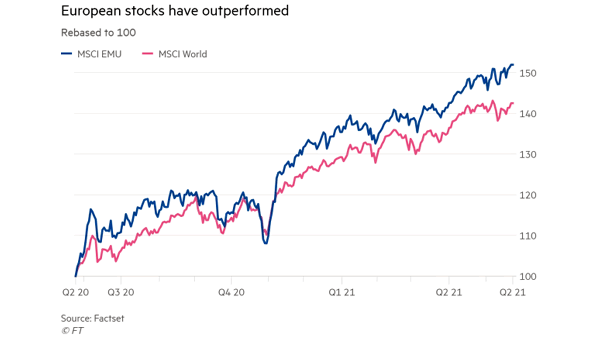
European Stocks and MSCI World Will European stocks continue to outperform global equities? Image: Financial Times
European Stocks and MSCI World Will European stocks continue to outperform global equities? Image: Financial Times
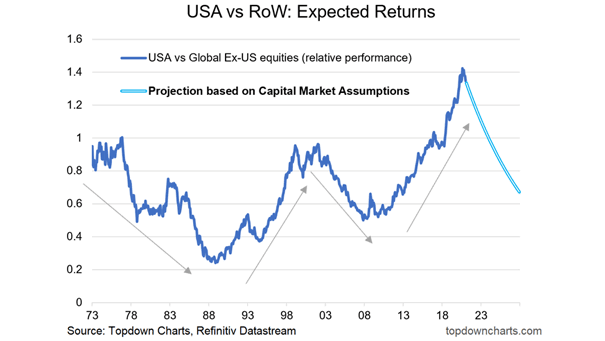
USA vs. Global Ex-U.S. Equities (Relative Performance) The U.S. stock market has significantly outperformed the rest of the world over the past decade. How long can the divergence continue? Image: Topdown Charts

Valuation – Cyclical Adjusted P/E Ratio – MSCI U.S. vs. MSCI World Ex-U.S. Are global equities ex-U.S. a bargain? Image: Gavekal, Macrobond
U.S. 30 Year Total Return Benckmark Government Index and All-Country World Total Return Index Could rising inflation be more painful for bonds than for equities? Image: BCA Research
Global Money Supply and MSCI World Index Global equities are around 1 standard devation vs. global money supply. It could be bullish for stocks, as global money supply growth tends to push equities higher. Image: Nordea and Macrobond
Performance over 12 Months: S&P 500 vs. FTSE All World and FTSE 100 U.S. equities had their best month since 1987, in the global rebound. Image: Financial Times
Number of Trading Days in a Bear Market (MSCI World Index) Stimulus and extremely low interest rates have moved global equities higher over past decade. Image: Financial Times
MSCI World Index vs. OECD Unemployment Rate and U.S. Consumer Confidence Chart suggesting that OECD unemployment troughs and very confident U.S. consumers do not generally bode well for global equities. Image: Morgan Stanley Research
World Semiconductor Sales Lead Emerging Markets This chart suggests that world semiconductor sales lead the MSCI emerging markets index by 3 months. This is very interesting before investing in emerging market equities. Country weights of the MSCI Emerging Markets Index: 33% China, 13.02% Korea, 11.35% Taiwan. Image: Nordea and Macrobond
MSCI Emerging Markets Index vs. World Semiconductor Sales This great chart suggests that world semiconductor sales lead the MSCI emerging markets index by 3 months. Very interesting chart before investing in emerging market equities. Country weights of the MSCI Emerging Markets Index: 33% China, 13.02% Korea, 11.35% Taiwan. Image: Nordea and Macrobond
Foreign Investor Ownership Share of U.S. Equity Market Foreign investors now hold a record 18% of U.S. stocks, but shifting trade policies and global economic uncertainties may affect future investment in American equities. Image: Goldman Sachs Global Investment Research