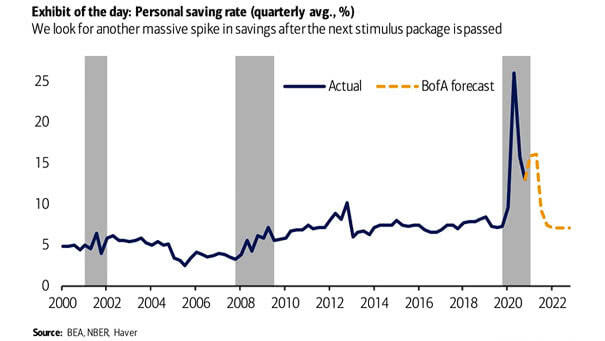
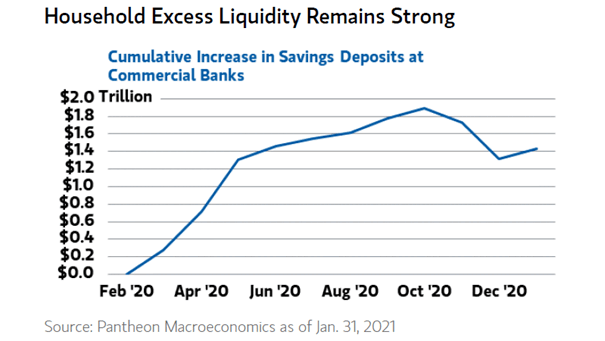
Personal Saving Rate and U.S. Stock Market
Personal Saving Rate and U.S. Stock Market Could the U.S. stock market see upside after the next stimulus is passed? Image: BofA Global Research
Market and U.S. Excess Personal Savings The market is likely driven by excess personal savings. Image: Morgan Stanley Wealth Management
U.S. Personal Saving Rate Since 1959 Precautionary saving could weigh down on consumption. Image: Deutsche Bank
U.S. Savings Rate Will the coronavirus pandemic lead to a permanent increase in the savings rate? Image: J.P. Morgan
Saving – Household Spending as % of Disposable Income and 10-Year Treasury Yield As the chart shows, lower yields force households to save more (hyper-globalization 2001-2020). This is a vicious cycle, as forced saving depresses demand. Image: BofA Research Investment Committee
U.S. Personal Saving Rate The personal savings rate soared to 33% in April, as coronavirus causing Americans to accumulate cash. Image: CNBC
U.S. Household and Personal Saving Rate Americans are accumulating cash, as savings rate hits its highest level since 1981. The Daily Shot – The Wall Street Journal
Percentage of U.S. Households with No Emergency Savings Acount, by Income 40% of U.S. households don’t have $400 for an emergency expense, and 53% don’t have any emergency savings. Image: Deutsche Bank Global Research
Inequality – Contribution to the Saving Rate by Income Quintile in the U.S. The top 20% of households account for almost all the savings in the United States. Image: Goldman Sachs Global Investment Research
Inequality – Net Saving by Wealth Class in the U.S. This chart shows that the savings rate for the bottom 90% of the U.S. population is negative since the 1990s. Image: Deutsche Bank Global Research