Secular Bull and Secular Bear Markets
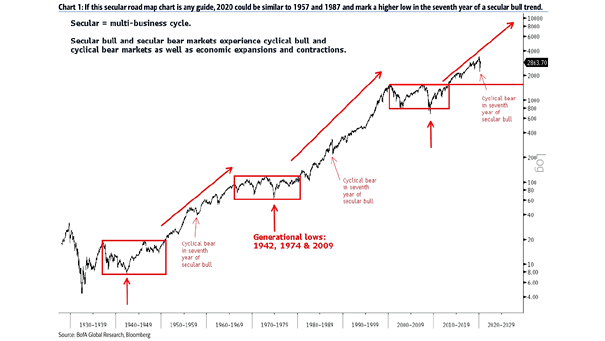
Secular Bull and Secular Bear Markets This year could be similar to 1957 and 1987, suggesting that the secular bull market is still intact for the time being. Image: BofA Global Research
Secular Bull and Secular Bear Markets This year could be similar to 1957 and 1987, suggesting that the secular bull market is still intact for the time being. Image: BofA Global Research
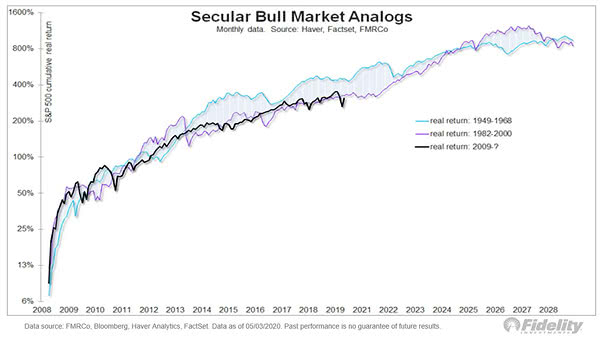
S&P 500 Real Return and Secular Bull Market Analogs Since the Great Recession, U.S. stocks have behaved like a secular bull market. Image: Fidelity Investments

Secular Bull Market – The S&P 500 and Its 200-Week Moving Average The 200-week moving average is a strong support level, suggesting that the secular bull market is still intact for the time being. Image: Credit Suisse
Secular Bull Market – S&P 500 with 200-Day and 200-Week Moving Averages This chart suggests that the secular bull market is intact, as the 200-week moving average is a strong support level. Image: Morgan Stanley Research
Secular Bull Market Analogs – 1949-1968 vs. S&P 500 since 2009 This chart compares the secular bull market of 1949-1968 vs. the S&P 500 since 2009. In 1962, the breadth thrust was about the same as today. Image: Fidelity Investments
Secular Bear Market – Big Up & Big Down Days Most big up & big down days tend to occur during secular bear markets. Image: BofA Global Research
S&P 500 and Secular Bull Market Behavior The S&P 500 below the 200-week moving average is not secular bull market behavior. Image: BofA Global Research
Secular Bull Market In Equities: MSCI Country Indices and Number of Years with Negative Real Total Return 60% of MSCI country indices have posted negative real return over the past 10 years. Image: Pictet Asset Management
S&P 500 and Secular Bull Market Corrections Chart suggesting that the 100-week MA and the 200-week MA are key secular market supports. Image: BofA Global Research
S&P 500 – Secular Bull Market Analogs The bull market that began in 2009 could have similarities with the secular bull markets of 1982-2000 and 1949-1968. Since the Great Recession, US stocks have behaved like a secular bull market. Image: Fidelity Investments
Secular Bull Market – S&P 500 and Small Caps vs. Large Caps Ratio This chart suggests that secular bull markets are bearish for small caps. Image: BofA Global Research