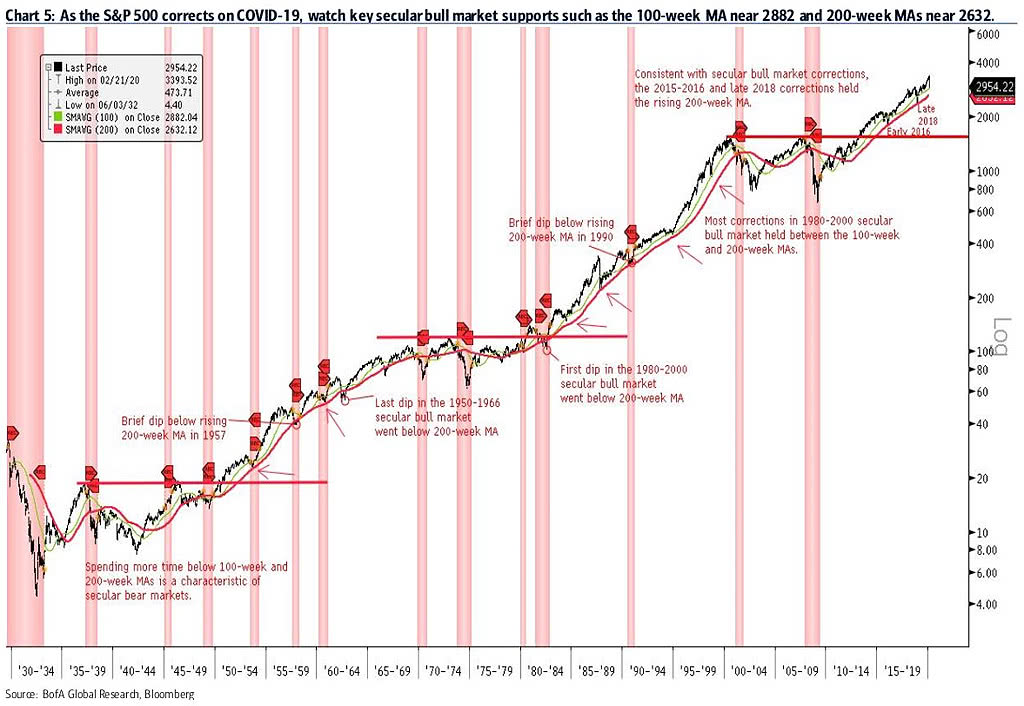
Mar 02 2020 Off S&P 500 and Secular Bull Market Corrections Chart suggesting that the 100-week MA and the 200-week MA are key secular market supports.Image: BofA Global Research