Jun
25
2025
Off
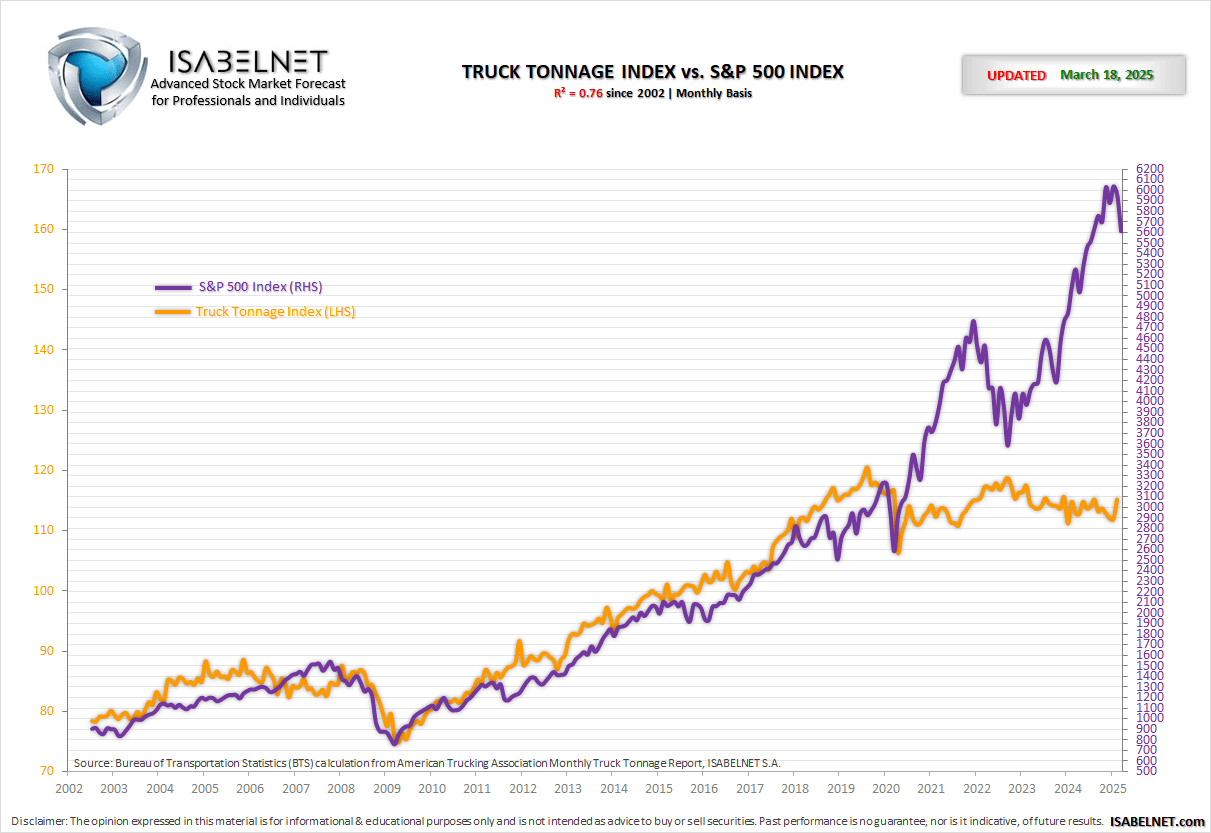
Truck Tonnage vs. S&P 500 Index
The Truck Tonnage Index decreased by 0.1% in May.
Trucks represent 72.7% of U.S. freight and serve as a barometer of the U.S. economy. This chart shows that, historically, the U.S. stock market tends to increase in line with the physical size and expansion of the U.S. economy (R² = 0.75 since 2002).
The Truck Tonnage Index is not a leading indicator of the U.S. stock market. But the chart is very interesting, because it shows how the U.S. stock market tends to follow the physical expansion and contraction of the U.S. economy.
