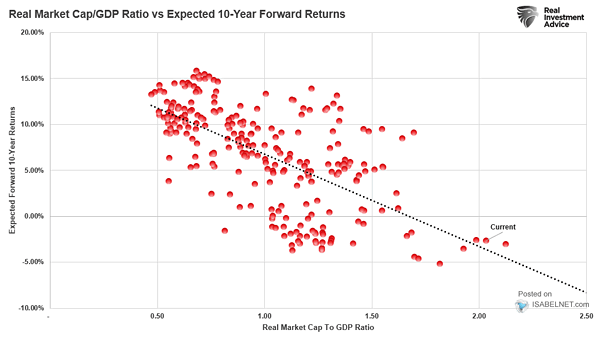
Cumulative Returns Around Bear Market Bottoms
Cumulative Returns Around Bear Market Bottoms Is the bear market bottom for the S&P 500 around 3,000? Image: Societe Generale Cross Asset Research
Largest S&P 500 10-Day Returns During Prior Bear Markets The recent U.S. equity rally has been very strong. Image: BofA Global Research
Returns – R-squared of Fed Balance Sheet YoY vs. YoY Change in S&P 500 Market Capitalization that is not Driven by Earnings Since 2010, the Fed balance sheet expansion tends to explain 52% of S&P 500 returns. Image: BofA US Equity & Quant Strategy
Bull Market – S&P 500 % Returns and Length of 50-Trading Day Breakouts Can the S&P 500 continue to rise? Image: Arbor Research & Trading LLC
U.S. Markets – 12-Month Return Boost/Drag vs. Average When the U.S. business cycle is in the expansion phase, the S&P 500 tends to have above-average returns over the next 12 months. Image: Morgan Stanley Research
Value Cumulative Returns – U.S. Stock Market Value has made a strong comeback in recent months. Image: Financial Times
S&P 500 Return – Equity Market Trends Around U.S. Capital Gains Tax Rate Hikes Equity prices tend to decline around U.S. capital gains tax hikes, but are likely to be short-lived. Image: Goldman Sachs Global Investment Research
Returns – The Impact of Missing the Market’s Best and Worst Days Each Decade Should investors avoid trying to time the market, given the difficulty of determining the peaks and troughs of the market? Image: CNBC
U.S. 10-Year Treasury Price Return During Bear Bond Markets Worried about a bear bond market? Image: BofA Global Research
Return and Valuation – Stocks with EV/Sales Ratios Above 20x as Share of U.S. Equity Trading Volumes and Market Capitalization The median stock with an EV/sales ratio above 20x has generated a subsequent 12-month return of -1% since 1985. Image: Goldman Sachs Global Investment Research