S&P 500 Following Yield Curve Inversions
S&P 500 Following Yield Curve Inversions Historically, the inversion of the 10Y-3M yield curve is not an immediate sell signal for U.S. stocks. Image: MarketDesk Research
U.S. Rates and Yield Curve The inverted 10Y-3M yield curve suggests that monetary policy is becoming too tight. Image: Fidelity Investments
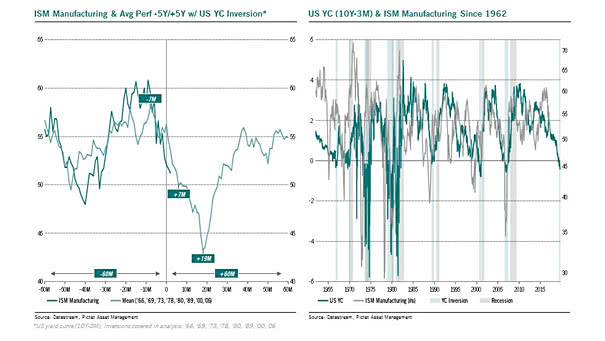
ISM Manufacturing Index and U.S. Yield Curve Inversion This chart suggests that the ISM Manufacturing Index tends to trough 19 months after the U.S. (10Y-3M) yield curve inverts. Image: Pictet Asset Management
S&P 500 Average Performance -2Y/+2Y with U.S. Yield Curve Inversion History tells us that on average, the S&P 500 peaks 42 weeks after (10Y-3M) yield curve inversion. Image: Pictet Asset Management