S&P 500 Average Return for Each Day

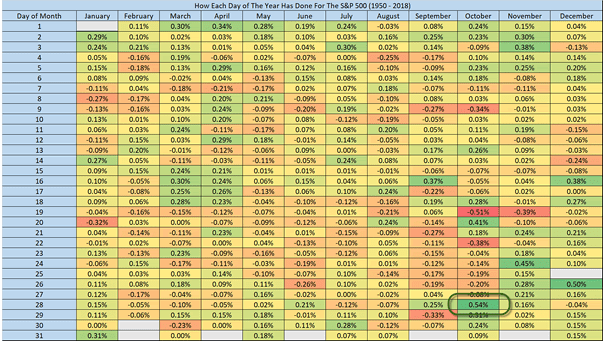
S&P 500 Average Return for Each Day This spreadsheet shows the S&P 500 average return for each day from 1950 to 2018. “History never repeats itself but it rhymes” –Mark Twain. October 28 has been historically the best day of the year for the S&P 500. You may also like “S&P 500 vs. Its Seasonal Pattern.” Image: Ryan…

Seasonality – S&P 500 Index Average Monthly Returns

Seasonality – S&P 500 Index Average Monthly Returns February’s returns may be flat, but the ride rarely is, making it one of the market’s more unpredictable stretches for U.S. stocks. Image: Carson Investment Research

Performance Based on Congress Makeup – Average S&P 500 Index Annual Return

Performance Based on Congress Makeup – Average S&P 500 Index Annual Return Since 1950, U.S. stocks have typically shone under a split Congress, posting an average annual gain of 15.1% as investors embrace the political gridlock that keeps sweeping policy changes in check. Image: Carson Investment Research

Annual Real S&P 500 Index and 3-Year Average Annual Return

Annual Real S&P 500 Index and 3-Year Average Annual Return The S&P 500 sits about 18% above its three‑year average, a strong run by any measure, but past rallies this sharp rarely come without some turbulence ahead. Image: Real Investment Advice

Average 1-Month S&P 500 Return vs. Change in 10-Year U.S. Treasury Yields

Average 1-Month S&P 500 Return vs. Change in 10-Year U.S. Treasury Yields When US Treasury yields rise quickly, equity valuations usually fall hardest among high-growth, richly priced names. One risk for 2026 is a sudden jump in interest rates. Image: Goldman Sachs Global Investment Research

Arithmetic Average Annual Real Return of S&P 500 over Different Periods

Arithmetic Average Annual Real Return of S&P 500 over Different Periods Since 2009, S&P 500 investors enjoyed annualized real returns about 50% above the 1900+ historic average, fueled by low rates, QE, and post-crisis recovery. With those supports behind us, forward returns may revert toward historic norms. Image: Real Investment Advice

Returns – Average Year for the S&P 500

Returns – Average Year for the S&P 500 October 27 has a curious pull on markets — a date when U.S. stocks often find a floor before seasonal inflows spark a late‑year surge. Image: Carson Investment Research

Annual Average IPO Return During First Trading Day

Annual Average IPO Return During First Trading Day The average U.S. IPO in 2025 has popped 30% on debut, with 72% of the 46 listings this year finishing their first session in the green—a sign of the market’s strong appetite for new deals. Image: Goldman Sachs Global Investment Research