Estimated Earnings Impact of 1pp Change in Statutory Tax Rate

Estimated Earnings Impact of 1pp Change in Statutory Tax Rate A one percentage point change in the corporate tax rate can have a measurable impact on U.S. corporate earnings, with small companies often feeling the effects more acutely than their larger counterparts. Image: Goldman Sachs Global Investment Research
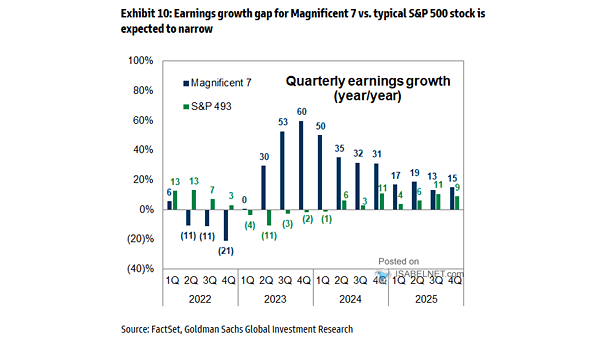
Earnings Growth

Earnings Growth While mega-cap tech companies are likely to maintain their market dominance, their EPS growth may decelerate. This could potentially narrow the EPS growth gap between these tech giants and the median S&P 500 companies. Image: Goldman Sachs Global Investment Research
S&P 500 Stocks – Average Earnings Day Moves

S&P 500 Stocks – Earnings Day Moves Last quarter set a 15-year record for earnings day volatility, with 12% of S&P 500 stocks experiencing price movements greater than 10%. Image: Goldman Sachs Global Investment Research

World Technology Earnings

World Technology Earnings The technology sector’s consistent outperformance relative to other sectors since 2010 can be attributed to its robust profit growth and the transformative impact of technological innovations like AI. Image: Goldman Sachs Global Investment Research

Percent of S&P 500 Market Cap Reporting Earnings

Percent of S&P 500 Market Cap Reporting Earnings With a significant number of S&P 500 companies set to report their earnings shortly, market participants will be closely monitoring these results for indications of economic health and sector-specific performance. Image: Goldman Sachs Global Investment Research

S&P 500 Historical Earnings-per-Share (EPS)

S&P 500 Historical Earnings-per-Share (EPS) The consensus projection suggests that the S&P 500 will achieve 18% EPS growth by the end of 2025, reflecting confidence in corporate profitability as we move into 2025. Image: BofA Global Investment Strategy

S&P 500 Earnings Estimates

S&P 500 Earnings Estimates The Magnificent Five are positioned for strong earnings growth through 2025, driven by superior sales growth, robust profit margins, and reasonable valuations relative to their growth potential. Image: Goldman Sachs Global Investment Research

Global EPS Model vs. Consensus EPS

Global EPS Model vs. Consensus EPS BofA indicates a trend of slowing growth in its global earnings per share model, reflecting a shift toward a more cautious economic outlook. Image: BofA Global Investment Strategy

Global Stocks

Global Stocks The value of global equities reached an all-time high of $125 trillion at the end of July 2024, driven by robust corporate earnings and investor confidence. Image: BofA Global Investment Strategy

Earnings – S&P 500 Consensus EPS Revision

Earnings – S&P 500 Consensus EPS Revision 2024 EPS estimates reflect a typical non-recessionary trend, indicating a favorable market outlook and the possibility of strong corporate profits. Image: Goldman Sachs Global Investment Research

Global Composite PMI and EPS Growth

Global Composite PMI and EPS Growth The Global Composite PMI serves as a leading indicator for EPS growth, with its trends providing insights into future corporate earnings performance. Image: J.P. Morgan