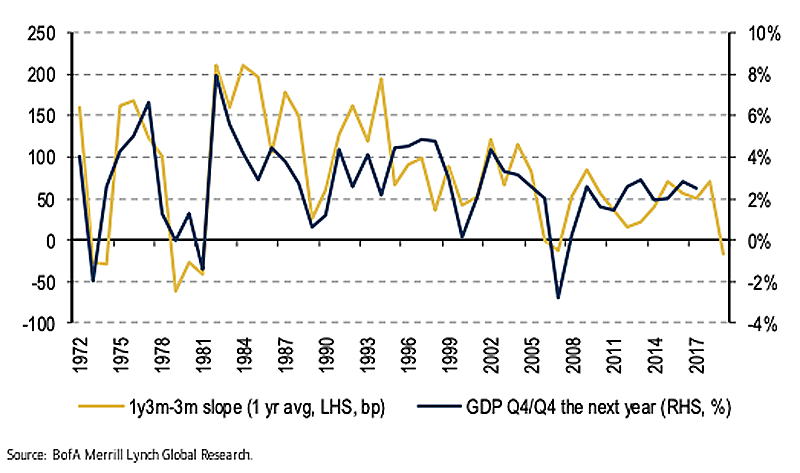
Aug 28 2019
Off
3-Month Rate 1-Year Forward vs. 3-Month Leads U.S. GDP
This chart suggests that the 1y3m-3m slope leads U.S. GDP.
The 1y3m-3m slope has turned down sharply and is informative for year-head growth.
Image: BofA Merrill Lynch
Advanced Stock Market Forecast for Professional and Individual
Connect with Us on Twitter
This chart suggests that the 1y3m-3m slope leads U.S. GDP.
The 1y3m-3m slope has turned down sharply and is informative for year-head growth.
Image: BofA Merrill Lynch