U.S. Net Worth by Wealth Bracket
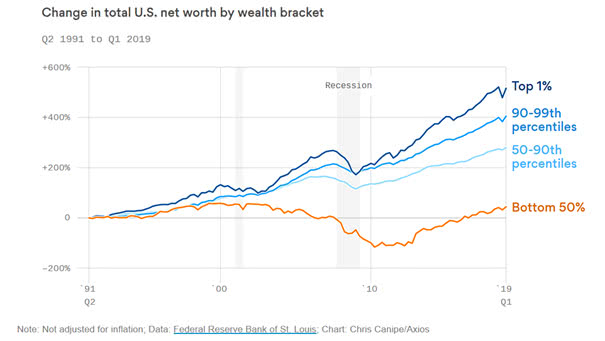
U.S. Net Worth by Wealth Bracket Another chart showing the wealth disparities before and after the Great Recession. Inequality: you may also like “Lower Incomes Paid the Highest Price.” Image: Axios
U.S. Net Worth by Wealth Bracket Another chart showing the wealth disparities before and after the Great Recession. Inequality: you may also like “Lower Incomes Paid the Highest Price.” Image: Axios
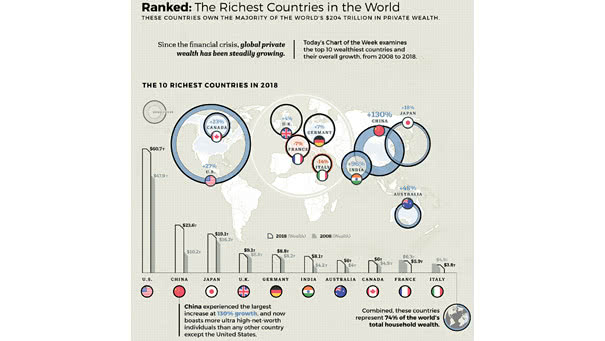
The Top Wealthiest Countries in 2018 The United States is the world’s largest wealth market with $60.7 trillion in 2018. Inequality: you may also like “Lower Incomes Paid the Highest Price.” Image: Visual Capitalist

The 10% Richest Households in the U.S. Own Almost 70% of All Wealth The 10% richest households in the US used to own 60% of all wealth. Now they own almost 70%. Inequality: you may also like “U.S. Net Worth by Wealth Bracket.” Image: Deutsche Bank Global Research
How the Composition of Wealth Changes from the Middle Class to The Ultra Rich? From the middle class to the ultra rich, the composition of household wealth changes dramatically. Inequality: you may also like “U.S. Net Worth by Wealth Bracket.” Image: Visual Capitalist
Homeownership Disparity Deepens Since 1994, the gap between blacks and whites has widened, in part because starter-home prices have exploded, year after year. Inequality: you may also like “U.S. Unemployment Rate: Black or African Americans” and “U.S. Net Worth by Wealth Bracket” and “Countries With the Highest Housing Bubble Risks.” Picture Source: Bloomberg
Lower Incomes Paid the Highest Price Low-income groups are slowly recovering after the financial crisis. Inequality: you may also like “U.S. Net Worth by Wealth Bracket.” Image: Deutsche Bank Global Research