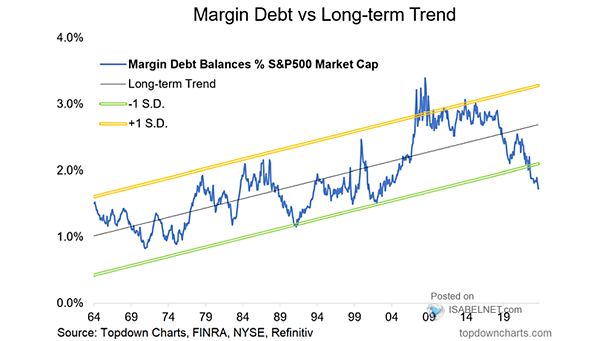
S&P 500 – Margin Debt vs. Long-Term Trend
S&P 500 – Margin Debt vs. Long-Term Trend A rise in the ratio of margin debt to the S&P 500 market cap could indicate a bullish outlook for the U.S. stock market, potentially signaling confidence in the market’s upward trajectory. Image: Topdown Charts