Seasonality of Market Performance – MSCI USA

Seasonality of Market Performance – MSCI USA August and September have historically been less favorable months for U.S. equities, with lower average performance compared to other months. Image: BofA Global Quantitative Strategy

Seasonality – Average Annualized S&P 500 Price Return by Month

Seasonality – Average Annualized S&P 500 Price Return by Month BofA’s strategists are cautioning investors about the potential for significant market corrections in the near term, driven by weak seasonal patterns and the uncertainties surrounding the U.S. election. Image: BofA US Equity & Quant Strategy

S&P 500 Seasonality Since 1928

S&P 500 Seasonality Since 1928 The seasonal trends observed since 1928 indicate a pattern where July and August typically see positive stock performance, followed by a dip in late summer and a rally into the year-end. Image: BofA Global Research

Seasonality Trends in MSCI AC World Index (Global Equities)

Seasonality Trends in MSCI AC World Index (Global Equities) July has historically been a strong month for global equities, offering opportunities for investors to capture potential gains. Image: BofA Global Quantitative Strategy

Seasonality – S&P 500 Index Returns in June

Seasonality – S&P 500 Index Returns in June The U.S. stock market has historically tended to be weak, and often negative, in the second half of June compared to other months of the year. Image: Carson Investment Research

S&P 500 Day of Month Seasonality Returns

S&P 500 Day of Month Seasonality Returns Considering seasonality, it would not be surprising to see a bounce-back in the S&P 500 in early June, as historically, this period has demonstrated a trend of positive returns. Image: BofA Global Research

Seasonality – S&P 500 Index Returns in May

Seasonality – S&P 500 Index Returns in May The middle of May is historically a period of weakness for U.S. stocks, while the end of May typically exhibits strength. Image: Carson Investment Research

S&P 500 3-Month Seasonal Returns and Presidential Cycle Year 4

S&P 500 3-Month Seasonal Returns and Presidential Cycle Year 4 June to August historically shines during election years, as it represents the strongest 3-month period in the fourth year of the presidential cycle, up 75% of the time with an average return of 7.27% since 1928. Image: BofA Global Research

S&P 500 – Seasonality During Bull vs. Bear Markets

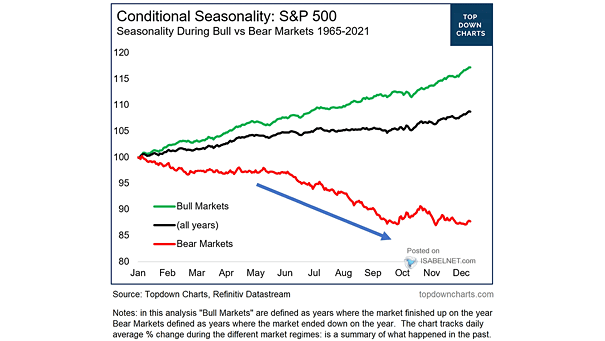
S&P 500 – Seasonality During Bull vs. Bear Markets The sell-in-May effect may be more relevant in bear markets. In bull markets, it may be seen as a missed opportunity for potential gains, given the positive momentum and upward trends typically observed in the market. Image: Topdown Charts

S&P 500 – Election Year Seasonality

S&P 500 – Election Year Seasonality During election years, the S&P 500 tends to trend sideways in Q1. Investors are typically cautious about the potential outcomes of the upcoming elections and tend to adopt a more conservative approach. Image: MarketDesk Research