S&P 500 Index vs. Margin Debt
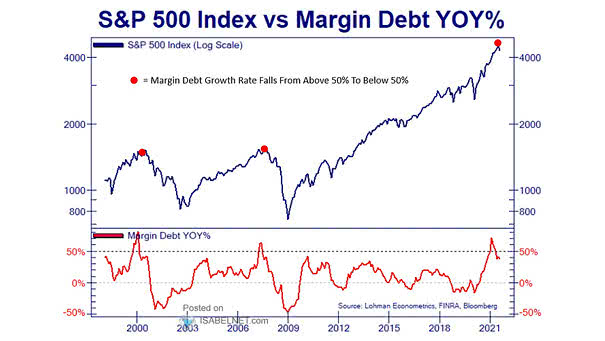
S&P 500 Index vs. Margin Debt Should investors be worried that the margin debt growth rate falls below 50%? Image: Lohman Econometrics
S&P 500 Index vs. Margin Debt Should investors be worried that the margin debt growth rate falls below 50%? Image: Lohman Econometrics
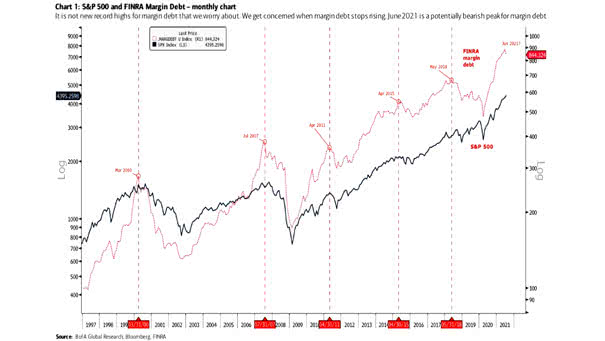
S&P 500 (Top) and Margin Debt (Bottom) In recent history, margin debt tends to peak in advance of highs in the S&P 500. Image: BofA Global Research Click the Image to Enlarge

Margin Debt as a Percentage of the Market Capitalization of the S&P 500 Downside corrections tend to occur after peaks in margin debt relative to the S&P 500 market capitalization. Image: BofA Global Research
U.S. Margin Debt / U.S. Wilshire 5000 Market Capitalization Margin debt could have room to run relative to the U.S. market capitalization. Image: BCA Research
Margin Debt and S&P 500 Should the growth of margin debt scare investors? Image: Nordea and Macrobond
U.S. Equities – Margin Debt Since 1960 Is the growth of margin debt a concern? Image: Morgan Stanley Research
U.S. Margin Debt and S&P 500 Total Return Is it time to worry about the growth of margin debt? Image: Nordea and Macrobond
YoY Absolute Change in U.S. Margin Debt and YoY % Change in S&P 500 Should investors be worried about the growth of margin debt? Image: Gavekal, Macrobond
U.S. Equities, Margin Debt and Composite Valuation Index Margin debt has reached an all-time high. Does market euphoria suggest a correction coming? Image: Alpine Macro
S&P 500 and Margin Debt Margin debt has still not recovered from last December’s lows. Usually, it is mostly bullish for stocks, because investors are still fearful. Image: Merk Investments
Margin Debt and S&P 500 This chart shows that margin debt has not recovered from last December’s lows, while the stock market has risen sharply.Usually, it is mostly bullish for stocks, because investors are still fearful. Image: Yardeni Research, Inc.