Cash + T-bills % of AUM
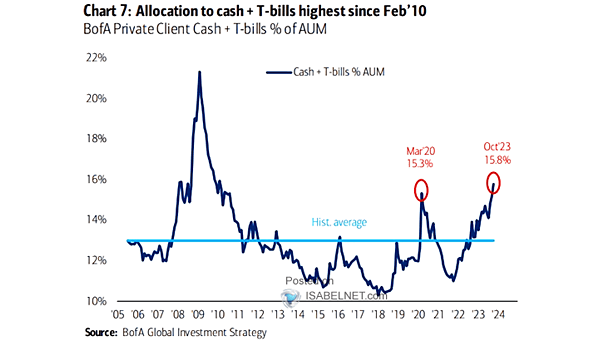
Cash + T-bills % of AUM Will cash and T-bills serve as the driving force behind the bull markets of 2024? Image: BofA Global Investment Strategy
Cash + T-bills % of AUM Will cash and T-bills serve as the driving force behind the bull markets of 2024? Image: BofA Global Investment Strategy
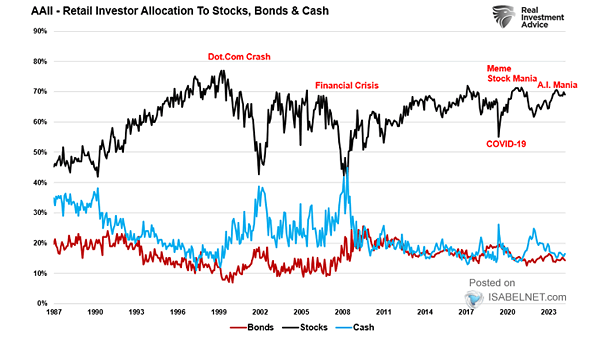
AAII Cash Allocations High levels of cash allocations by AAII members can be a good contrarian indicator. Image: Topdown Charts

U.S. Equity Mutual Funds – Cash and Liquid Assets Cash holdings of mutual funds are going down. Image: Goldman Sachs Global Investment Research
Cash – U.S. Money Market Funds Deposits as a % of Total Equity and Bond Market Value Cash on the sidelines is not as elevated as many believe. Image: BCA Research
Cumulative Quarterly Inflow to Cash Cash is making a strong comeback as interest rates rise. Image: BofA Global Investment Strategy
Bank Cash As a Share of Total Assets U.S. banks have plenty of cash on hand and most banks are in very good shape. Image: Gavekal, Macrobond
Cash Flows Will flows into cash continue to be strong as rates rise? Image: BofA Global Investment Strategy
Average Recommended Allocation to Cash by Wall Street Strategists Cash may not be the wisest choice for long-term investments, but cash yields are currently at attractive levels. Image: BofA US Equity & Quant Strategy
Cash Equities Plus ETFs Short Interest Short interest in U.S. stocks and ETFs is currently very low. What could go wrong? Image: Deutsche Bank Asset Allocation
Performance vs. S&P 500 by Uses of Cash U.S. companies that spend the most cash on dividends and buybacks have outperformed the S&P 500 since 1992. Image: Goldman Sachs Global Investment Research