MSCI AC World – Bear Market Rallies
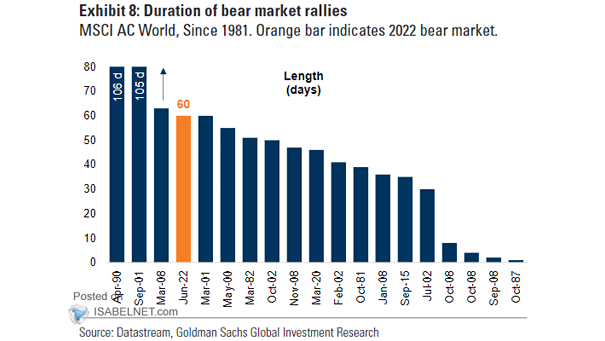
MSCI AC World – Bear Market Rallies Since the 1980s, there have been 19 global bear market rallies, lasting 44 days on average with MSCI AC World returns of 10–15%. Image: Goldman Sachs Global Investment Research
MSCI AC World – Bear Market Rallies Since the 1980s, there have been 19 global bear market rallies, lasting 44 days on average with MSCI AC World returns of 10–15%. Image: Goldman Sachs Global Investment Research
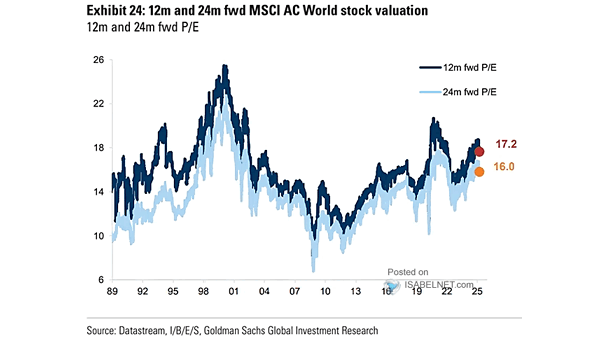
Valuation – MSCI World 12-Month Forward PE The current global stock market valuation, with a 12-month forward P/E ratio of 17.2, is relatively high compared to its 20-year median. Image: Goldman Sachs Global Investment Research

MSCI Ex-US Developed World Stock Price Index Relative to MSCI US Stock Price Index vs. US Real Dollar Index There is often an inverse relationship between the U.S. dollar and international stock markets, meaning that a peak in the dollar could make international stocks more appealing to investors. Image: Paulsen Perspectives
World Technology Earnings The consistent outperformance of the technology sector since 2010 is largely due to its strong profit growth and the disruptive impact of advancements like artificial intelligence. Image: Goldman Sachs Global Investment Research
DXY U.S. Dollar Index vs. Nasdaq Composite / MSCI World Value Over the past two years, U.S. growth stocks—known for their sensitivity to currency fluctuations—have exhibited a strong correlation with the U.S. dollar. Image: Gavekal, Macrobond
MSCI World Performance vs. U.S. Dollar Index Typically, the relationship between the U.S. dollar’s strength and global equities is significant. A weaker U.S. dollar tends to support global equities, while a stronger dollar generally puts downward pressure on them. Image: J.P. Morgan
The World Economy – GDP by Country The United States has maintained its position as the world’s largest economy for over a century and is projected to continue this trend in 2025, unless, of course, aliens land and demand a trade deal! Image: Visual Capitalist
MSCI World EPS The decline in MSCI AC World EPS consensus estimates for 2025 reflects a cautious stance among analysts as they navigate an uncertain economic landscape marked by slower growth and sector-specific challenges. Image: Goldman Sachs Global Investment Research
Performance of U.S. vs. Rest of World Equities Investing in U.S. corporations is like betting on a horse that always finishes the race—sure, it might stumble, but it usually crosses the finish line ahead of the pack! Image: BlackRock Investment Institute
MSCI World Fwd PE and EPS Revisions Downward revisions in global EPS raise concerns, suggesting that the global economic landscape is precarious, prompting central banks to adopt more aggressive strategies to stimulate growth. Image: J.P. Morgan
U.S. Dollar Index and Rest of the World GDP A weaker U.S. dollar typically bodes well for the global economy by boosting growth prospects, improving trade dynamics, and encouraging investment in international markets. Image: BofA Predictive Analytics