Funds Flow – Fixed Income and Equities
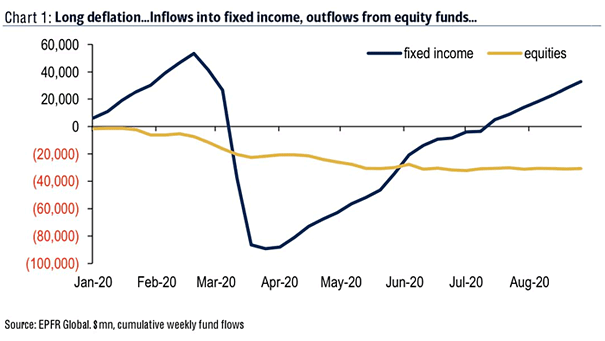
Funds Flow – Fixed Income and Equities Fixed income funds continue to recover, but equity funds experienced 22 weeks of outflows this year. Image: BofA
Funds Flow – Fixed Income and Equities Fixed income funds continue to recover, but equity funds experienced 22 weeks of outflows this year. Image: BofA
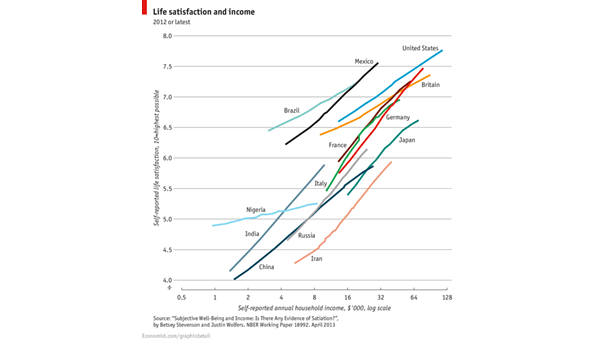
Life Satisfaction and Income Does money buy happiness? This chart suggests that life satisfaction and income tend to go hand-in-hand. Image: The Economist

U.S. Personal Disposal Income Growth vs. U.S. GDP Growth Morgan Stanley is bullish on U.S. market, as personal disposable income growth is at record levels. Image: Morgan Stanley Research
S&P 500 Cash Return Payout Ratios (% of Net Income) S&P 500 payout ratio is in secular decline, as S&P 500 companies shift to buybacks. Image: Goldman Sachs Global Investment Research
Funds Flows – Fixed Income and Equities Funds flows across fixed income and equities continued to slow for a third week. Image: BofA Global Research
Saving – Household Spending as % of Disposable Income and 10-Year Treasury Yield As the chart shows, lower yields force households to save more (hyper-globalization 2001-2020). This is a vicious cycle, as forced saving depresses demand. Image: BofA Research Investment Committee
Housing – U.S. Median Famility Income to Mortgage Cost This chart suggests that relative to family incomes, buying a home in the U.S. is currently quite affordable by historical standards. Image: Gavekal, Macrobond
Global Cumulative Weekly Flow: Fixed Income vs. Equities This chart highlights once again investors’ strong preference for bonds. Image: BofA Global Research
U.S. Total Disposable Personal Income This chart suggests that disposable personal income will be positive in Q2/Q3 2020. Image: Goldman Sachs Global Investment Research
Percentage of U.S. Households with No Emergency Savings Acount, by Income 40% of U.S. households don’t have $400 for an emergency expense, and 53% don’t have any emergency savings. Image: Deutsche Bank Global Research
Private Non-Financial Debt Service Ratios Relative To Income Lower interest rates make debt more sustainable. What matters is the debt service cost.