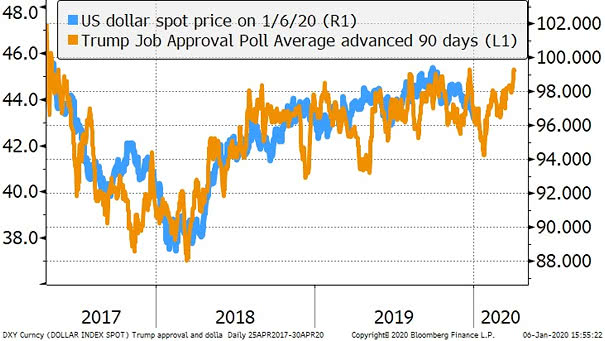
Fed Funds Target Rate and VIX

Fed Funds Target Rate and VIX Is more volatility expected ahead? This great chart suggests that the Fed funds target rate leads VIX by 2 years. You may also like “VIX is in a Transitory State” and “The Yield Curve Leads Volatility by Three Years.” Image: Bloomberg, Jeffrey Kleintop

Conference Board U.S. Leading Index vs. U.S. GDP Growth

Conference Board U.S. Leading Index vs. U.S. GDP Growth This chart shows the strong correlation between the Conference Board U.S. Leading Index Year-over-Year and U.S. GDP growth. The U.S. LEI suggests a weakness in U.S. GDP growth in Q2 2019. It is also a good recession indicator. Image: Pictet Wealth Management

Leading Indicators Show Growth Is Slowing, But Is Still Positive

Leading Indicators Show Growth Is Slowing, But Is Still Positive Since 1970, the Leading Economic Index has turned negative year-over-year, on average 14 months before all recessions. U.S. growth is slowing, but the current LEI rose 2.7% year-over-year and suggests there is no imminent recession on the horizon. Image: LPL Research