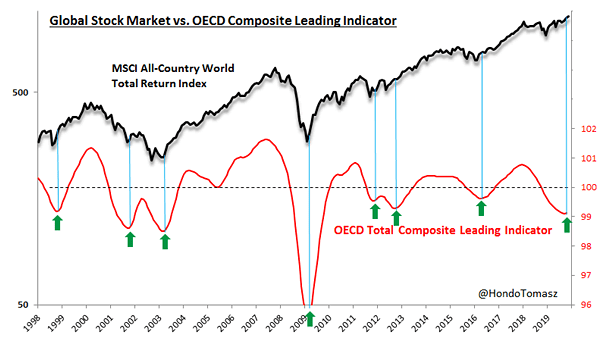
MSCI ACWI Total Return Index – Rallies and Corrections

MSCI ACWI Total Return Index – Rallies and Corrections Interesting chart showing the deviation of the MSCI AC World Total Return Index against its trend line, like the swing of a pendulum. Image: Fidelity Investments

MSCI ACWI and Global Composite PMI

MSCI ACWI and Global Composite PMI Chart suggesting that global equities expect a pickup in global growth, as policy stimulus takes effect. Image: Morgan Stanley Research

MSCI ACWI Index – Bull and Bear Market

MSCI ACWI Index – Bull and Bear Market As Morgan Stanley points out, this is the “unsatisfying bear market”, difficult for both bulls and bears. Image: Morgan Stanley Research

Dividend Yield of MSCI ACWI Stocks

Dividend Yield of MSCI ACWI Stocks Currently, more than 1,100 global stocks are paying dividends above the average yield of global government bonds. Image: BofA Merrill Lynch

MSCI ACWI ex-U.S. and S&P 500 Index

MSCI ACWI ex-U.S. and S&P 500 Index U.S. equities have significantly outperformed the rest of the world in recent years, but this has not always been the case. You may also like “Trailing 12-month Return Differential between U.S. and non-U.S. Stocks.” Image: ClearBridge Investments