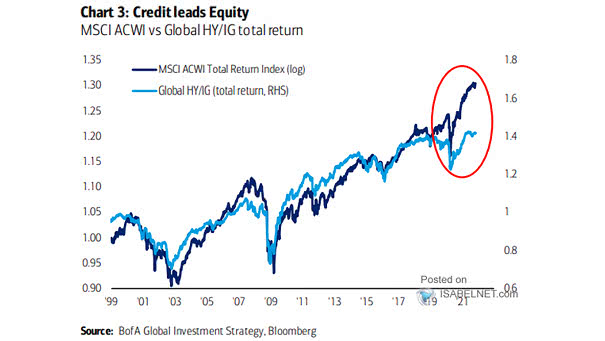
Global Manufacturing PMI vs. MSCI ACWI

Global Manufacturing PMI vs. MSCI ACWI PMI’s are peaking. Historically, markets tend to lead the macro for most time periods. Image: BofA Global Investment Strategy

Returns – G7 + China Free Liquidity and MSCI ACWI (Leading Indicator)

Returns – G7 + China Free Liquidity and MSCI ACWI (Leading Indicator) Global free liquidity continues to rise. When global free liquidity is above 10%, equity markets tend to perform well: the average next 12-month return is 23.4% with a hit ratio of 100% since 2009. Image: BofA Global Research