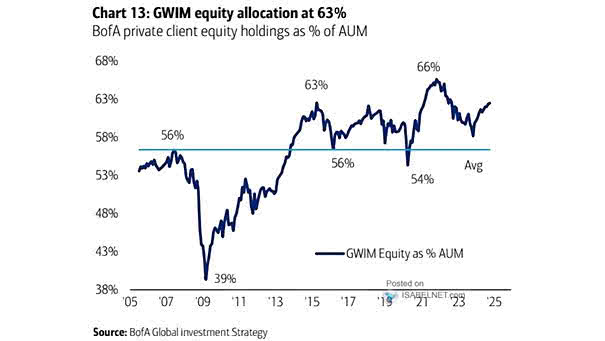
GWIM Equity Allocation as % Assets Under Management

GWIM Equity Allocation as % Assets Under Management BofA’s private clients show optimism about equity market growth and potential returns, as evidenced by their 63% portfolio allocation to equities. Image: BofA Global Investment Strategy

Implied Equity Allocation by Non-Bank Investors Globally

Implied Equity Allocation by Non-Bank Investors Globally Despite concerns about potential economic slowdowns, investors are currently maintaining an overweight position in global equities, suggesting a positive outlook for stock markets. Image: J.P. Morgan

Stocks vs. Bonds – Relative Allocations

Stocks vs. Bonds – Relative Allocations U.S. stocks are relatively expensive compared to bonds. Are investors too aggressively positioned in U.S. stocks relative to bonds? Image: Topdown Charts

FMS Tech Net Allocation

FMS Tech Net Allocation Bye-bye tech? Tech net allocation fell to the lowest level since August 2006. Image: BofA Global Fund Manager Survey

Inflows to Equities vs. Allocations to Equities

Inflows to Equities vs. Allocations to Equities Despite the fact that FMS investors are very bearish equities, there is no capitulation yet. Image: BofA Global Investment Strategy

Implied Allocations: Gold Miners

Implied Allocations: Gold Miners Allocation to gold miners remains low. Should investors be bullish on gold miners as valuations are reasonable? Image: Topdown Charts

Tech Stocks – FMS Tech Allocation

Tech Stocks – FMS Tech Allocation U.S. investors are net underweight in the technology sector, while global investors are net overweight in this sector. Image: BofA Global Fund Manager Survey