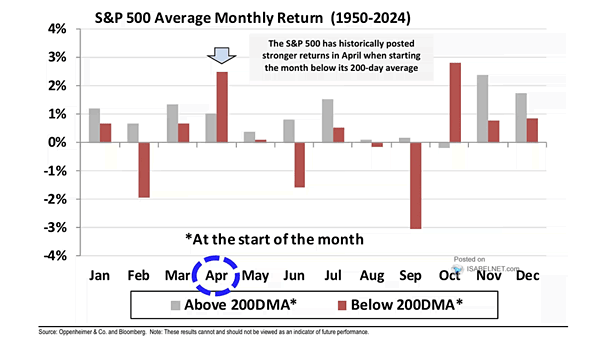
S&P 500 Index Returns Based on If January Is Higher or Lower

S&P 500 Index Returns Based on If January Is Higher or Lower Bulls have reason to smile: a positive January often sets the tone for a bullish year. When the S&P 500 finishes the month higher, history shows full-year gains averaging 16.9% since 1950. Image: Carson Investment Research

S&P 500 Annual Performance Based On What The First Five Days Do

S&P 500 Annual Performance Based On What The First Five Days Do A bullish start to the year for the S&P 500 lifts investor spirits. When the index is up more than 1% in the first 5 trading days, it has historically led to stronger annual returns, averaging 15.7% and ended higher 87% of the…

S&P 500 Returns After Fed Cuts Within 2% of an All-Time High

S&P 500 Returns After Fed Cuts Within 2% of an All-Time High Bears are losing ground as history leans bullish. Since 1980, when the Fed has eased policy while the S&P 500 traded within 2% of an all‑time high, the index has risen every time in the next 12 months, averaging a 14.2% gain Image:…

S&P 500 2026 Price Target

S&P 500 2026 Price Target Major banks see the S&P 500 averaging 7,500 by the end of 2026, roughly 10% above current levels. Deutsche Bank is the most bullish, calling for 8,000 as earnings broaden beyond tech leaders and AI momentum holds. Image: Financial Times

S&P 500 Returns When New Highs Are Made In October

S&P 500 Returns When New Highs Are Made In October A slow start to November may not tell the whole story. When the S&P 500 hits a new high in October, history leans bullish, with the index averaging 3.5% over November and December and finishing higher nearly nine times out of ten. Image: Carson Investment…

S&P 500 Index Peak-to-Trough During a Midterm Year

S&P 500 Index Peak-to-Trough During a Midterm Year Midterm years often bring large pullbacks — but history says don’t panic. Since 1950, every midterm-year bottom in U.S. stocks has been followed by a powerful rebound, averaging gains of more than 30% over the next 12 months. Image: Carson Investment Research

Margin Debt as % of U.S. Nominal GDP

Margin Debt as % of U.S. Nominal GDP NYSE margin debt exceeding $1.1 trillion, near record highs relative to nominal GDP, signals rapid investor re-leveraging and heightened volatility risk, though not necessarily implying an imminent market crash. Image: Deutsche Bank

S&P 500 Returns When New Highs Are Made In September

S&P 500 Returns When New Highs Are Made In September For the bulls, September’s new highs are more than just cosmetic. Since 1950, a new high in September has been followed by a fourth-quarter rally over 90% of the time, averaging gains of 4.7%. Image: Carson Investment Research

S&P 500 Performance After 90-90 Days

S&P 500 Performance After 90-90 Days The NYSE “90/90 day” on Friday—when 90% of volume and stocks rose—is rare and bullish. Since 1980, such days often precede strong market gains, with the S&P 500 rising over 90% of the time a year later, averaging 23% gains.

S&P 500 Performance After Green in Both May and June

S&P 500 Performance After Green in Both May and June Since 1988, when the S&P 500 gains in both May and June—a rare bullish sign—the rest of the year rose 15 of 16 times, averaging 8.8% gains, indicating strong momentum and positive investor sentiment for the year’s second half. Image: Carson Investment Research