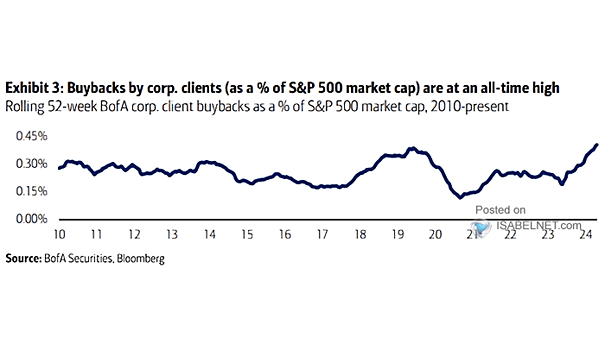
Corporate Client Buybacks as a % of S&P 500 Market Capitalization
Corporate Client Buybacks as a % of S&P 500 Market Capitalization BofA’s corporate clients are currently engaging in significant stock buyback activities, marking an all-time high. This trend is generally perceived as a positive indicator for the broader market. Image: BofA Securities