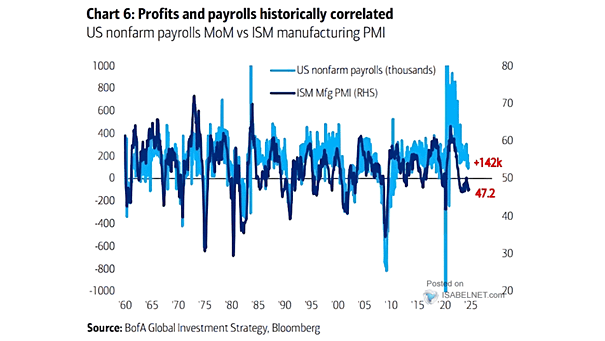
U.S. Nonfarm Payrolls vs. U.S. ISM Manufacturing PMI

U.S. Nonfarm Payrolls vs. U.S. ISM Manufacturing PMI The U.S. ISM manufacturing index reading below 50 signals a contraction in manufacturing activity, which may impact payroll numbers. However, the relationship between the index and actual payroll figures is not straightforward. Image: BofA Global Investment Strategy
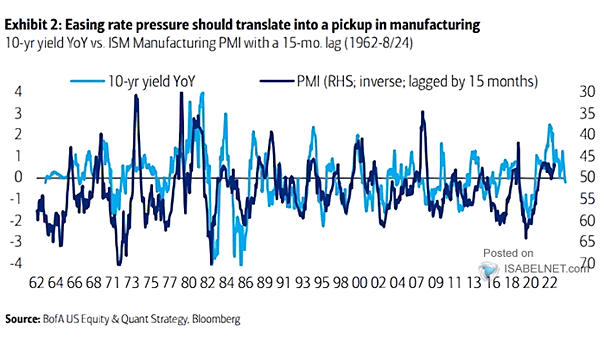
U.S. ISM Manufacturing PMI vs. 10-Year U.S. Treasury Yield

U.S. ISM Manufacturing PMI vs. 10-Year U.S. Treasury Yield Easing rate pressure is projected to facilitate a recovery in U.S. manufacturing as financial conditions improve, inflation declines, and both domestic and foreign demand strengthen. Image: BofA US Equity & Quant Strategy

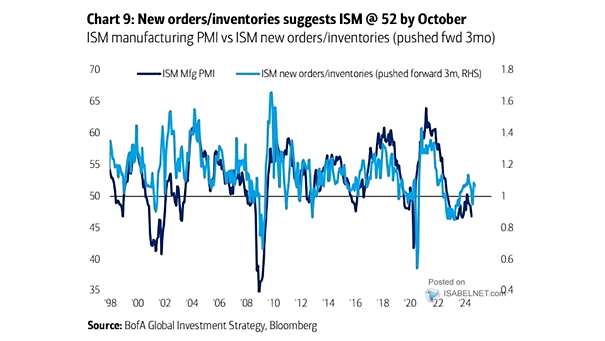
ISM Manufacturing PMI and ISM New Orders – Inventories

ISM Manufacturing PMI and ISM New Orders – Inventories The spread between U.S. ISM New Orders and Inventories suggests a positive upward trend in the ISM manufacturing PMI, with new orders increasing at a more rapid pace than inventories. Image: BofA Global Investment Strategy
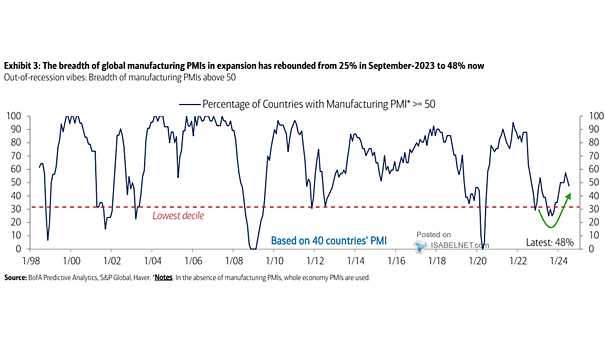
Percentage of Countries with Manufacturing PMI Above 50

Percentage of Countries with Manufacturing PMI Above 50 While the global manufacturing sector faced headwinds in mid-2023, the latest data suggest a gradual recovery is underway, with the percentage of countries in expansion nearly doubling from September 2023 to the present. Image: BofA Predictive Analytics

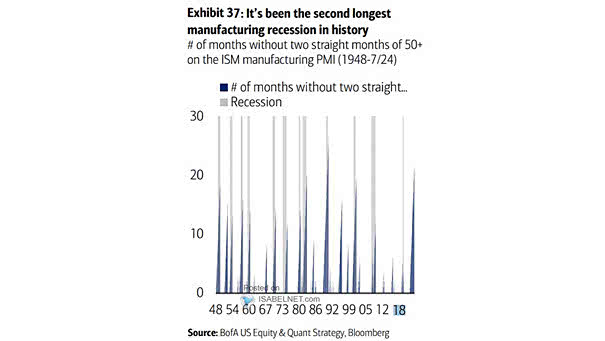
U.S. ISM Manufacturing Index and Recessions

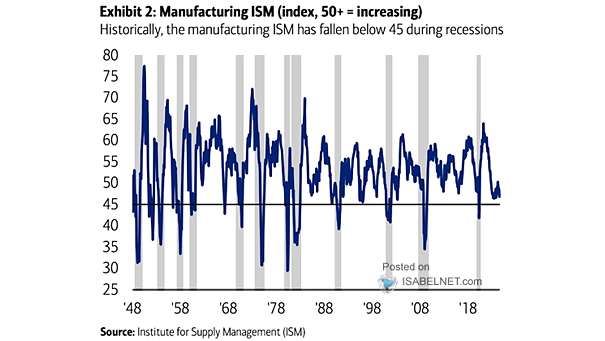
U.S. ISM Manufacturing Index and Recessions The U.S. manufacturing sector is currently experiencing its second longest downturn in modern history, attributed to various factors, including elevated interest rates that have suppressed demand. Image: BofA US Equity & Quant Strategy

ISM Manufacturing PMI and U.S. Recessions

ISM Manufacturing PMI and U.S. Recessions A drop in the U.S. ISM Manufacturing PMI below 45 signals significantly heightened recession risks, indicating a severe contraction in the manufacturing sector. Image: BofA Global Research

ISM Manufacturing PMI and Global Stocks vs. Government Bonds

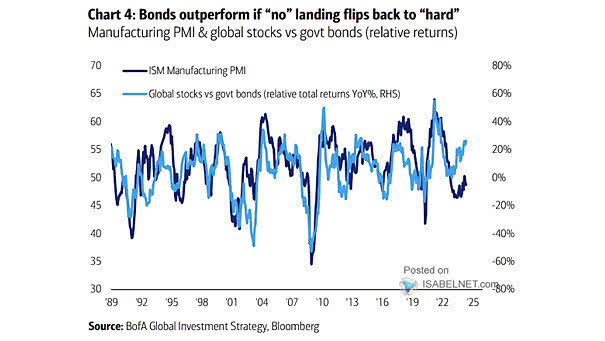
ISM Manufacturing PMI and Global Stocks vs. Government Bonds In a potential shift from a “no” to a “hard” landing scenario, government bonds may outperform due to increased risk aversion, interest rate cuts, lower inflation expectations, and their historical performance during economic downturns. Image: BofA Global Investment Strategy
U.S. ISM Manufacturing PMI vs. S&P 500 EPS Growth

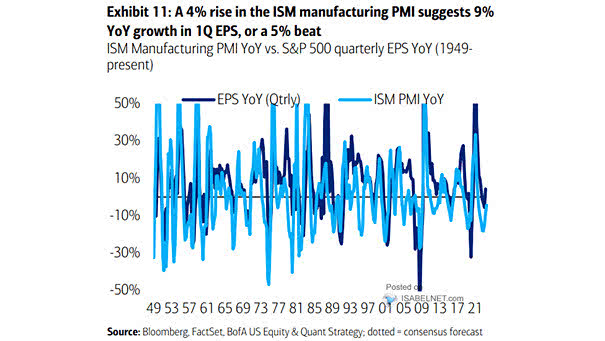
U.S. ISM Manufacturing PMI vs. S&P 500 EPS Growth A rise in the U.S. ISM manufacturing PMI is suggesting positive growth in 1Q EPS, with expectations of outperforming the initial projections. Image: BofA US Equity & Quant Strategy

U.S. ISM Manufacturing Index and U.S. GDP Growth

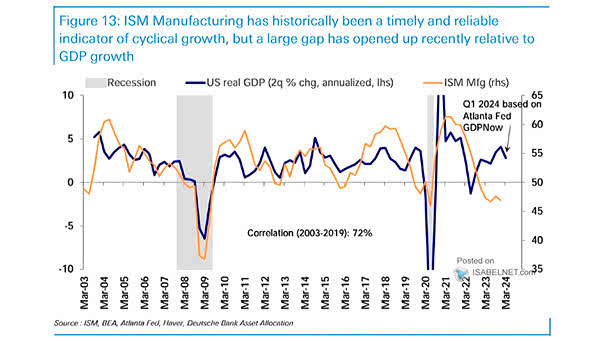
U.S. ISM Manufacturing Index and U.S. GDP Growth The large gap that currently exists between the U.S. ISM Manufacturing Index and U.S. real GDP will eventually close, as economic indicators tend to align over time. Image: Deutsche Bank Asset Allocation

ISM Manufacturing Index and SOX Philadelphia Semiconductor Index

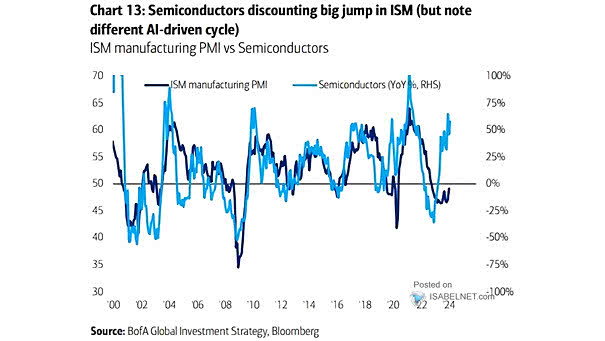
ISM Manufacturing Index vs. Semiconductors Semiconductors are discounting a substantial rise in the U.S. ISM Manufacturing PMI, which suggests a robust expansion in manufacturing activity and overall economic growth. Image: BofA Global Investment Strategy