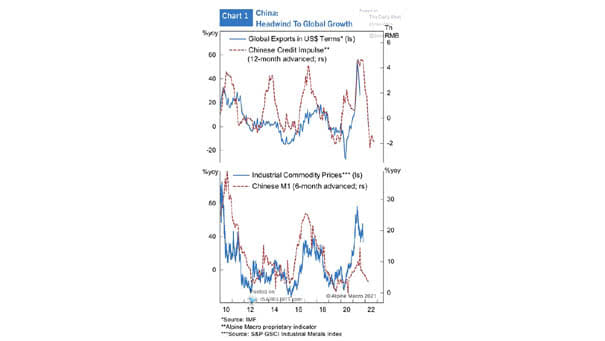
CRB Raw Industrials to Gold Ratio
CRB Raw Industrials to Gold Ratio Does the CRB raw industrials index to gold ratio suggest higher 10-year UST yields? Image: BCA Research
Net % of FMS Investors Overweight Industrial Stocks FMS investor allocations to industrial stocks fell to 12%. Image: BofA Global Fund Manager Survey
U.S. 10-Year Treasury Yield vs. Industrials/Precious Metals How long will the U.S. 10-year Treasury yield diverge from industrials/precious metals? Image: Morgan Stanley Wealth Management
1000-Point Milestone for the Dow Jones Industrial Average So far, the sun shines on the U.S. stock market. But historically, market exuberance does not end well. Image: Real Investment Advice
U.S. 10-Year Treasury Yield and Industrial Metals/Precious Metals Index Historically, U.S. rates tend to rise when growth is strong, as it is today. Image: Morgan Stanley Wealth Management
Cyclical Stocks – PMI YoY Change and Industrials vs. Market Will cyclical stocks lead markets higher as the economy recovers? Image: Morgan Stanley Wealth Management
China – Industrialization Level and Urbanization Level China continues to rise as an industrial power. Image: BCA Research
Performance – Banks, Industrials, Materials and Energy Relative to S&P 500 Pandemic losers are the winners year-to-date, as the rotation remains intact. Image: Alpine Macro
Valuation – Dow Jones Industrial Average from 1921 to 1954 It took the Dow Jones 25 years to regain its 1929 highs. Is the U.S. stock market currently in bubble territory? Image: Financial Times
China Real GDP and Industrial Production China is experiencing a strong V-shaped economic recovery from the coronavirus pandemic. Image: BofA Global Investment Strategy
Dow Jones Industrial Average vs. S&P 500 The Dow Jone Industrial Average is lagging the S&P 500, as it is underweight in technology and overweight in financials and industrials. Image: CNBC