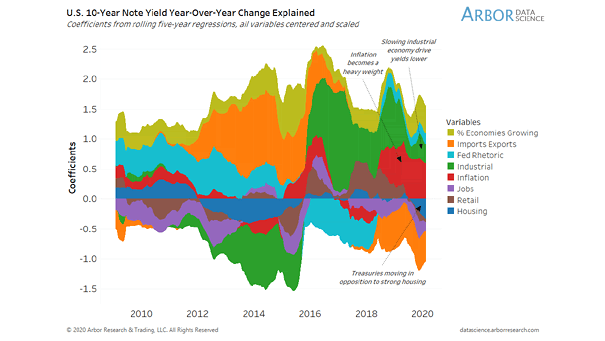
The SARS Analog – Virus Outbreaks and Global Markets

The SARS Analog – Virus Outbreaks and Global Markets The chart shows the SARS analog (2002 vs. 2020), highlighting the S&P 500 Index, the MSCI China Index, emerging markets vs. U.S. EPS and the CRB Raw Industrials Index. Image: Fidelity Investments

ANZ Global Lead Index

ANZ Global Lead Index The ANZ Global Lead Index is a leading indicator on global industrial production. The chart shows that growth momentum peaked in 2018. Currently, global growth is actually starting to moderate seriously. Image: ANZ Research

Forward Performance Following First Fed Funds Rate Cuts

Forward Performance Following First Fed Funds Rate Cuts After first Fed rate cut, the S&P 500 performance is quite attractive on average when no recession. You may also like “Dow Jones Industrial Average Around First Fed Rate Cut.” Image: Strategas

Dow Jones Index since 1896

Dow Jones Index since 1896 This great chart shows the Dow Jones Industrial Average Index since 1896 and lengthy periods of time with zero returns (dividends are not included). That’s the reason why we develop stock market forecasting models. Image: Mohnish Pabrai