The Dow Jones Industrial Average Since 1896
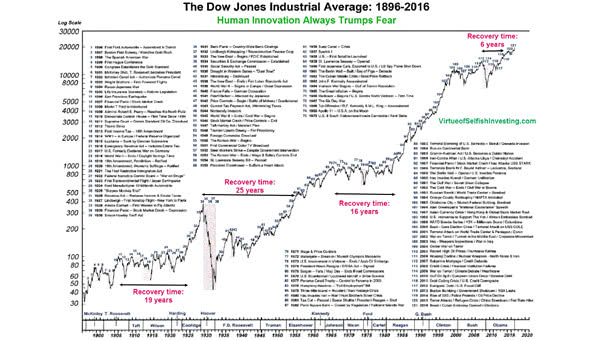
The Dow Jones Industrial Average Since 1896 If you listen to the news, there is always a good reason not to be invested in the stock market. You may also like “The Stock Market Continues to Climb the Wall of Worry.” Image: virtueofselfishinvesting.com Click the Image to Enlarge