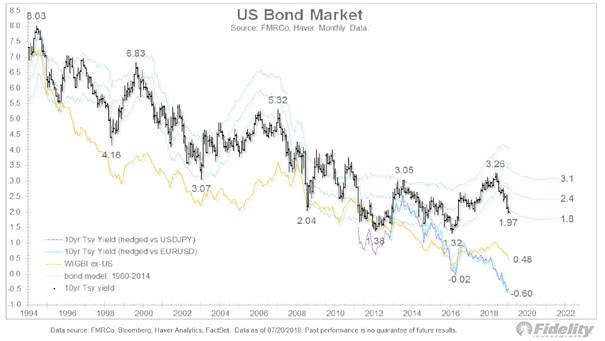
U.S. Bond Market Hedged and Unhedged
U.S. Bond Market Hedged and Unhedged Investors are frantically searching for yield, knowing that 25% of all bonds in the world trade at negative interest rates. Our world is aging with high levels of debt and low interest rates (maybe for a long time). Image: Fidelity Investments