CRB Raw Industrials to Gold Ratio
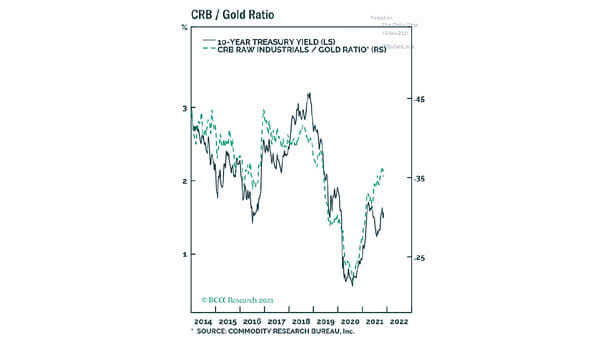
CRB Raw Industrials to Gold Ratio Does the CRB raw industrials index to gold ratio suggest higher 10-year UST yields? Image: BCA Research
CRB Raw Industrials to Gold Ratio Does the CRB raw industrials index to gold ratio suggest higher 10-year UST yields? Image: BCA Research
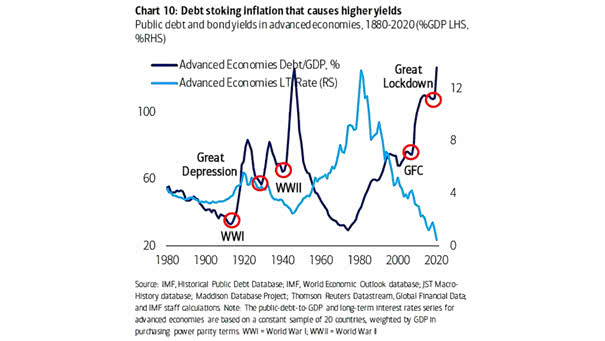
Advanced Economies Debt/GDP and Advanced Economies Long-Term Rate Will rising debt lead to higher inflation and higher yields? Image: BofA Global Research

Performance – Dogs of the Dow vs. S&P 500 from the 2020 Low The Dogs of the Dow (10 highest yielding stocks in the Dow Jones) are lagging the S&P 500 from the March low. Bullish rotation into lagging names is needed for the Dow Dogs to outperform the S&P 500 this year. Image: BofA…
Equity Allocation Investors allocation to equities is high. But with cash and bonds offering little or no yield, investors are likely to rotate cash into stocks. Image: Goldman Sachs Global Investment Research
Valuation – World Technology Equities Rising bond yields could hurt the tech sector, as it is very sensitive to higher yields. Image: BCA Research
Net Positioning Among Asset Managers in Treasury Futures Contracts Investors expect higher long-term bond yields as the economy improves in the future. Image: Financial Times
Cumulative Bond Flows Since 2009 Flows into high-yield funds had been out of favor in this cycle. Is this good news? Image: Deutsche Bank Asset Allocation
U.S. Equities and Global Equities ex-U.S. This chart suggests that higher yields could cause great rotation from bonds to stocks, US equities to non-US equities, growth to value, large caps to small caps, tech stocks to bank stocks, credit to commodities,… Image: BofA Global Investment Strategy
U.S. Dollar and S&P 500 Equity Risk Premium Higher bond yields reduce the S&P 500 equity risk premium, which weakens the U.S. dollar. Image: Morgan Stanley Research
U.S. Treasuries Volatility Curve Short-term periods of inversion have been followed by higher U.S. Treasuries yields and tighter credit spreads. Image: Arbor Research & Trading LLC
Historical Default Rate and Recession Periods in the U.S. Default rates on high-yield corporate bonds have exceeded 10% over the past three recessions. Image: Altman-Kuehne and NBER