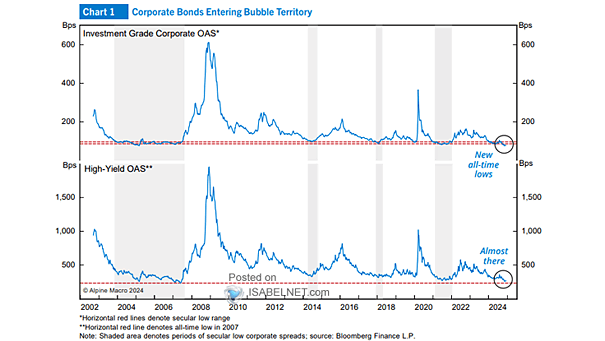
U.S. Corporate Bond Spreads
U.S. Corporate Bond Spreads U.S. corporate bond spreads are currently at historically tight levels, suggesting potential bubble-like conditions. While a major correction is not guaranteed, several factors indicate rising risks in the first half of 2025. Image: Alpine Macro