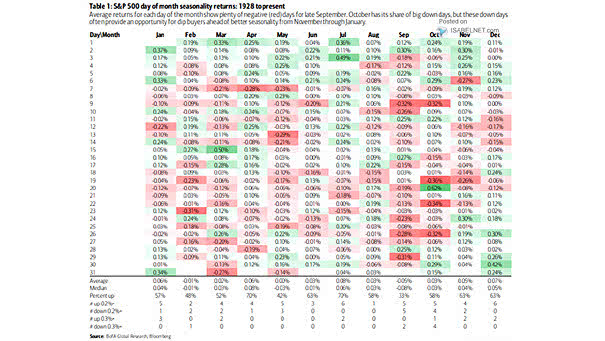
S&P 500 Day of Month Seasonality Returns
S&P 500 Day of Month Seasonality Returns Considering seasonality, it would not be surprising to see a bounce-back in the S&P 500 in early June, as historically, this period has demonstrated a trend of positive returns. Image: BofA Global Research