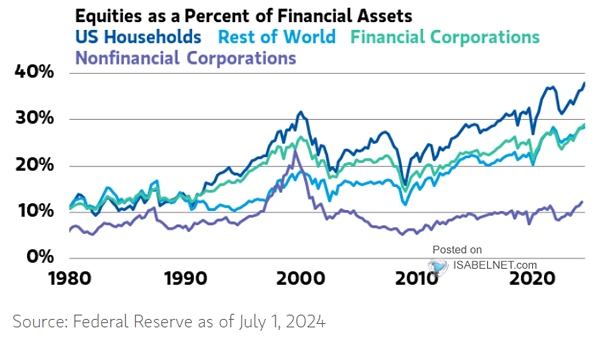
Equities as a Percent of Financial Assets
Equities as a Percent of Financial Assets With favorable market conditions and increasing stock valuations, Americans now hold more than 37% of all assets in equities, marking a record high. Image: Morgan Stanley Wealth Management