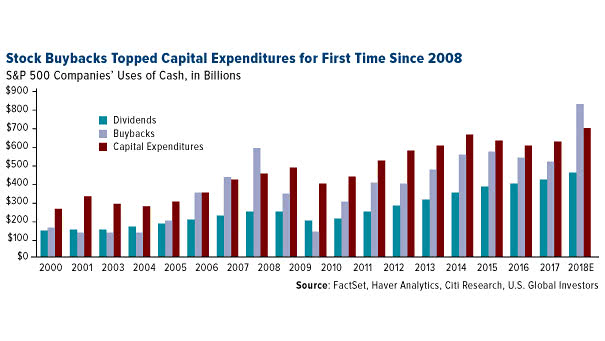
Big Starts to a Year Can Produce Weak Results Going Forward

Big Starts to a Year Can Produce Weak Results Going Forward While new all-time highs and consecutive winning streaks can produce above-average returns in the longer term, pullbacks are possible in the short term. Our previous two articles: “Sell in May and Go Away?” and “Sell in May and Go Away? Maybe Not this Year“…

Can History Help Us Predict the Future of the S&P 500?

Can History Help Us Predict the Future of the S&P 500? When the S&P 500 hits all-time high and AAII Investor Sentiment Survey bulls is below 35%, then 88% of the time the S&P 500 is positive one year later (1986-2019). Image: SentimenTrader

MSCI AC World Calendar Year Returns vs. Intra-Year Declines

MSCI AC World Calendar Year Returns vs. Intra-Year Declines Despite median intra-year drops of 15%, the global equity index ended positively in 34 of the past 45 years—highlighting the value of long-term investing over reacting to short-term volatility. Image: Goldman Sachs Global Investment Research

U.S. Federal Debt Growth and Gold Price

U.S. Federal Debt Growth and Gold Price While the increase in U.S. federal debt has traditionally correlated with higher gold prices, multiple other factors significantly influence gold’s market value. Image: Deutsche Bank

U.S. Misery Index and Average Forward Returns

U.S. Misery Index and Average Forward Returns The U.S. misery index (core inflation + unemployment) is approaching all-time low, because both inflation and unemployment are very low. Historically, average forward returns have been higher than the overall S&P 500 average.