VIX Seasonality
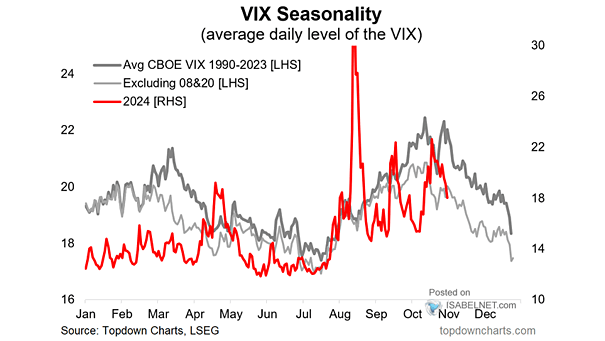
VIX Seasonality As the 2024 U.S. presidential election approaches, market volatility is expected to remain elevated but should decline after the election results are known. Image: Topdown Charts
VIX Seasonality As the 2024 U.S. presidential election approaches, market volatility is expected to remain elevated but should decline after the election results are known. Image: Topdown Charts
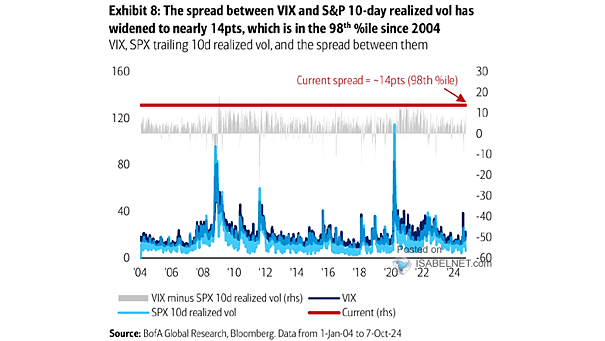
VIX Index and S&P 500 Realized Volatility The spread between the VIX and the S&P 10-day realized volatility, when in the 98th percentile, may signal a potential opportunity for U.S. stocks to rally towards the end of the year. Image: BofA Global Research

Yield Curve vs. VIX (Leading Indicator) Should U.S. equity investors anticipate increased volatility ahead, given that the yield curve typically leads the VIX by three years? Image: BofA US Equity & Quant Strategy
Volatility – VIX and U.S. Election The historical trend of the VIX spiking before U.S. elections and then rapidly declining afterward can be attributed to heightened uncertainty and investor fear in the lead-up to the elections. Image: Morgan Stanley Research
S&P 500 and VIX Above 50 When the VIX exceeded 50, the S&P 500 was higher a year later in 91 out of 92 instances since 1990, with an average gain of 33%. Image: Carson Investment Research
S&P 500 Forward 6-Month Performance vs. VIX Level Very high VIX readings may actually precede periods of strong market performance over the subsequent 6 months, as investor sentiment stabilizes and confidence returns. Image: Strategas Research Partners
Fed Funds vs. VIX Taking into account the lag effect of Fed rate hikes on the U.S. economy, should investors expect the VIX to continue being elevated? Image: Deutsche Bank
S&P 500 and 3-Month VIX Relative to VIX (VIX3M/VIX) The 3-month VIX relative to the VIX closing at an oversold level below 1 is a potentially significant indicator of market sentiment. This can be interpreted as a sign of capitulation and possibly a contrarian bullish signal. Image: BofA Global Research
VIX Average Trend in U.S. Election Years Historical patterns suggest that the VIX tends to bottom out in mid to late August, followed by a trend of increasing volatility as the U.S. Election Day approaches, driven by heightened market uncertainty. Image: BofA Global Research
VIX vs. S&P 500 The lack of a significant increase in the VIX during the market decline may indicate that widespread panic selling is absent. Image: Real Investment Advice
Volatility Divergence – VIX vs. MOVE The divergence between VIX and MOVE presents unique challenges and opportunities for market participants, reflecting different expectations and perceptions of risk in the equity and bond markets. Image: BofA Global Research