Bond Market – Rally in U.S. Treasuries
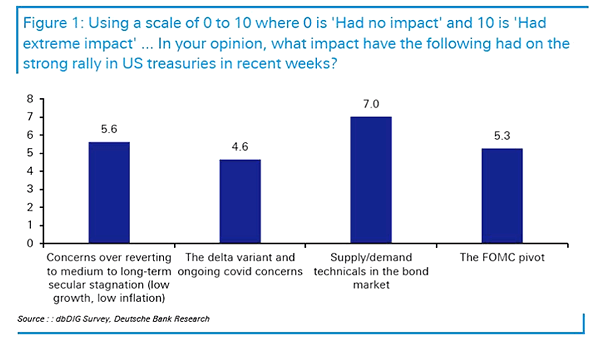
Bond Market – Rally in U.S. Treasuries Is the recent rally in U.S. Treasuries over? Image: Deutsche Bank Research
Bond Market – Rally in U.S. Treasuries Is the recent rally in U.S. Treasuries over? Image: Deutsche Bank Research
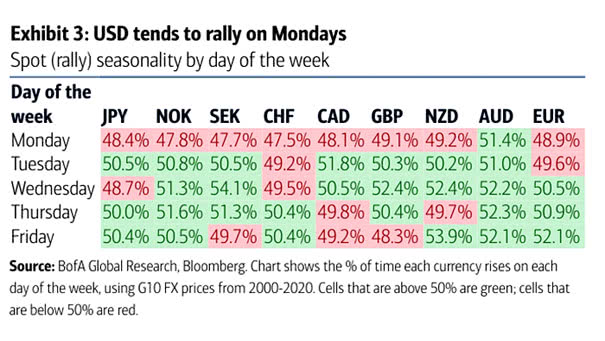
U.S. Dollar – Spot (Rally) Seasonality by Day of the Week The U.S. dollar tends to rally on Mondays since 2000. Image: BofA Global Research

S&P 500 Rally in Comparison with Rallies in 1929, 1938, 1974 and 2009 The current rally is the greatest of all time U.S. stock market rally. Image: BofA Global Investment Strategy
Seasonality – Santa Claus Rally and S&P 500 Returns A bullish Santa Claus rally tends to bode well for January and the full year. Image: LPL Research
S&P 500 Bull Market Rally – 1929 vs. 2020 Should investors expect a market similar to that of 1929 going forward? Image: BofA Global Investment Strategy
S&P 500 Index Drawdowns After Rally Off Lows After major bear market lows in place, pullbacks are actually perfectly normal. Image: LPL Research
Current Rally of S&P 500 vs. Greatest Bear Market Rallies of All-Time This chart puts into perspective the current rally of S&P 500 vs. greatest bear market rallies of all-time. The potential trajectory could suggest the S&P 500 at 3300-3600. Image: BofA
Bear Market Rally – 10-Day MA of New 52-Week Highs Minus 10-Day MA of New 52-Week Lows The 10-day MA of new 52-week highs minus 10-day MA of new 52-week lows suggests a week rally for the S&P 500. Image: BofA Global Research
Bear Market Rally – S&P 500 “Bounced” in 2008 To put the current bear market rally in perspective, this chart shows that the S&P 500 “bounced” six times by 9% to 19% in 2008. Image: Goldman Sachs Global Investment Research
Global Growth, Equity Rally and Fed Balance Sheet This chart suggests that economic data is the driving force behind the equity rally, not the Fed’s balance sheet. Image: Arbor Research & Trading LLC
U.S. Stock Market: Nasdaq Rally Chart suggesting that the current Nasdaq rally isn’t a replay of the dotcom bubble Images: CNBC