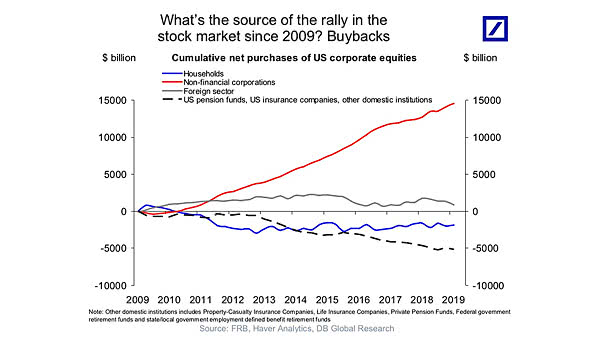
China trade deal could spark a big rally, says Jeremy Siegel

China trade deal could spark a big rally, says Jeremy Siegel Jeremy Siegel is the Russell E. Palmer Professor of Finance at the Wharton School of the University of Pennsylvania in Philadelphia. He comments on China trade talks and the effects on the stock market. He’s worry that the dollar has been very strong. https://www.youtube.com/watch?v=_7Y1id-I88I

Why Warren Buffett Says That Stocks Are Generally Better Than Bonds?

Why Warren Buffett says that stocks are generally better than bonds? Our equity risk premium model shows when the US stock market return for the next 10 years is more or less attractive than the 10-Year Treasury Note. Since 1970, the 10-year Treasury Note was less attractive than the US stock market over a 10-year…

Positions in S&P 500 Equity Futures by Asset Managers

Positions in S&P 500 Equity Futures by Asset Managers Even with the recent rally and record highs in US equities, asset managers’ positions in U.S. equity futures are still lower than they were at the beginning of the year. Image: J.P. Morgan

VIX – Volatility Indexes

S&P 500 and VIX Although U.S. stocks are rallying and volatility remains low—reflecting market confidence—significant underlying threats from rising trade frictions and policy uncertainty persist. Image: Bloomberg

Indexed S&P 500 Return – Market Hours vs. Overnight

Indexed S&P 500 Return – Market Hours vs. Overnight Following the April market turmoil, most of the rally has happened during regular U.S. trading hours, with overnight returns remaining relatively muted. Image: Deutsche Bank Asset Allocation

Average Annual Inflation of 152 Countries Since 1971

Average Annual Inflation of 152 Countries Since 1971 The post-Bretton Woods monetary system features greater inflation variability and generally higher average inflation, making it difficult for countries to keep inflation consistently below 2% over the long term. Image: Deutsche Bank

Oil Prices and Events

Oil Prices and Events Higher oil prices act like a tax on the economy, cutting disposable income and raising business costs, which can slow growth or cause recessions. However, these spikes are generally short-lived because demand falls and markets adapt. Image: Real Investment Advice

S&P 500 Net Non-Commercial Futures % Open Interest

S&P 500 Net Non-Commercial Futures % Open Interest Large speculators’ bearish positioning in the S&P 500 aligns with historical patterns seen near market lows, supporting the contrarian view that a rally is more likely if shorts are forced to cover. Image: Fundstrat Global Advisors, LLC

S&P 500 Earnings Yield Minus U.S. 10-Year Treasury Yield

S&P 500 Earnings Yield Minus U.S. 10-Year Treasury Yield The recent rally has made U.S. equities relatively expensive compared to bonds. Historically, when the risk premium has been at current levels, the S&P 500 has delivered an average 12-month return of only 2.5% over the past three decades. Image: Bloomberg

Sahm Rule Recession Indicator – U.S. Unemployment Rate

Sahm Rule Recession Indicator – U.S. Unemployment Rate A drop in the Sahm Rule indicator below 0.5 is a positive sign, as it suggests the rule is not currently signaling a U.S. recession—a generally reassuring indicator for economic health. Image: Bloomberg