S&P 500 vs. Corporate Profits After Tax

S&P 500 vs. Corporate Profits After Tax The current divergence between the S&P 500 and corporate profits after tax is the widest on record. It is possible to close the gap “down” with a recession. Image: Real Investment Advice

U.S. Corporate Profits and 10Y-3M Yield Curve

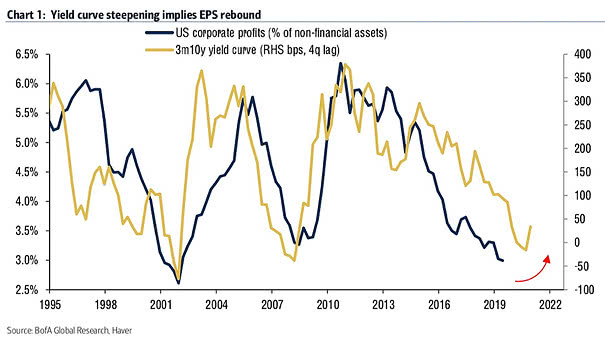
U.S. Corporate Profits and 10Y-3M Yield Curve While the divergence between large-cap profits and the rest of the economy is the widest on record, the steepening yield curve suggests an earnings rebound. Image: BofA Global Research

U.S. Corporate Profits vs. Assets

U.S. Corporate Profits vs. Assets U.S. corporate profits are near 20-year lows relative to fixed assets. The alternative to a recovery in corporate profits is the increasing risk of recession. Image: BofA Global Research

U.S. Corporate Profits vs. S&P 500 EPS

U.S. Corporate Profits vs. S&P 500 EPS The current divergence between large-cap profits and the rest of the economy is the widest on record. It is possible to close the gap “down” (recession) or “up” (reflation). Image: BofA Global Research

U.S. Corporate Profits and S&P 500

U.S. Corporate Profits and S&P 500 Corporate profits have mostly been flat over the past five years. Is a new bubble being formed? Image: Oxford Economics, Macrobond

Global Nominal GDP and Corporate Profits

Global Nominal GDP and Corporate Profits This chart shows the correlation and the slowdown in global growth and corporate profits. Historically, margin pressures have preceded the start of recessions. Image: J.P. Morgan