S&P 500 and NIPA Corporate Profits After Tax
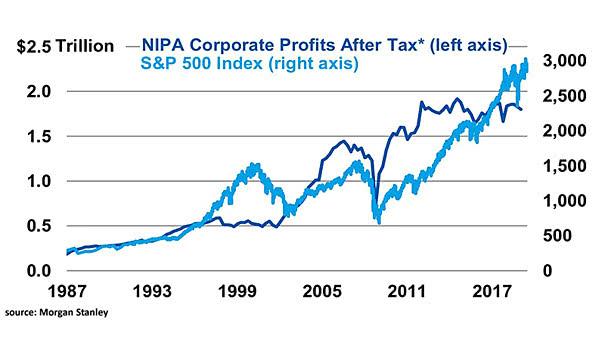
S&P 500 and NIPA Corporate Profits After Tax S&P 500 rose relative to NIPA corporate profits after tax, thanks to buybacks. Image: Morgan Stanley
S&P 500 and NIPA Corporate Profits After Tax S&P 500 rose relative to NIPA corporate profits after tax, thanks to buybacks. Image: Morgan Stanley
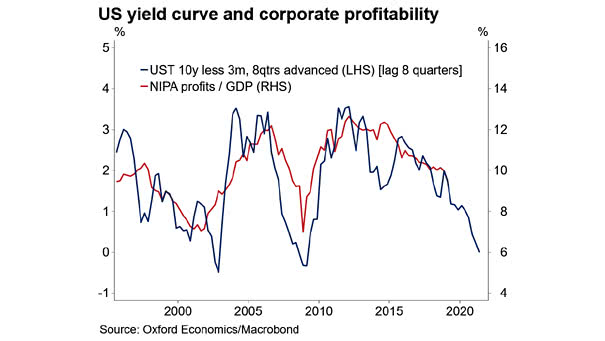
U.S. Yield Curve Leads Corporate Profits This chart suggests that the U.S. 10-year less 3-month yield curve leads corporate profits by two years. Image: Oxford Economics, Macrobond

S&P 500 EPS vs. U.S. Nonfinancial Corporate Profits Creative accounting is imaginative ways to present accounts. The divergences between earnings and U.S. nonfinancial corporate profits occur before recessions. Image: Gavekal, Macrobond
U.S. Corporate Sector Profits vs. CEO Confidence Weak CEO confidence suggests that U.S. corporate profits are at risk. Image: Longview Economics
Cumulative Change in Real S&P 500 and Real Profits The widening gap between the real S&P 500 index and real corporate profits is raising red flags about a potential stock market bubble. Image: Real Investment Advice
S&P 500 EPS Estimates ex-Tech and Communications The S&P 500’s earnings growth is heavily dependent on the technology sector, highlighting the crucial role that tech companies play in driving overall corporate profits in the United States. Image: Bloomberg
S&P 500 TTM YoY EPS vs. Fed Funds Target Traditionally, when the Fed starts cutting interest rates, corporate profits tend to decelerate. However, this’s not the case today, highlighting the unique economic landscape we face. Image: BofA US Equity & Quant Strategy
U.S. NIPA Profit Margins and Recessions U.S. corporate profits are booming. Image: Oxford Economics
Emerging Markets Exports Value and MSCI Emerging Markets 12m Trailing EPS Chart suggesting that EM corporate profits are linked to the global trade cycle. Image: Gavekal, Macrobond
What’s The Risk Of An Earnings Recession in 2019? Maybe Less Than You May Think US-China trade uncertainty is the enemy of growth, and the impact of tariffs will weigh on corporate profits. But it looks like we’ll avert an earnings recession in 2019 if a trade deal with China is reached this summer. Image:…