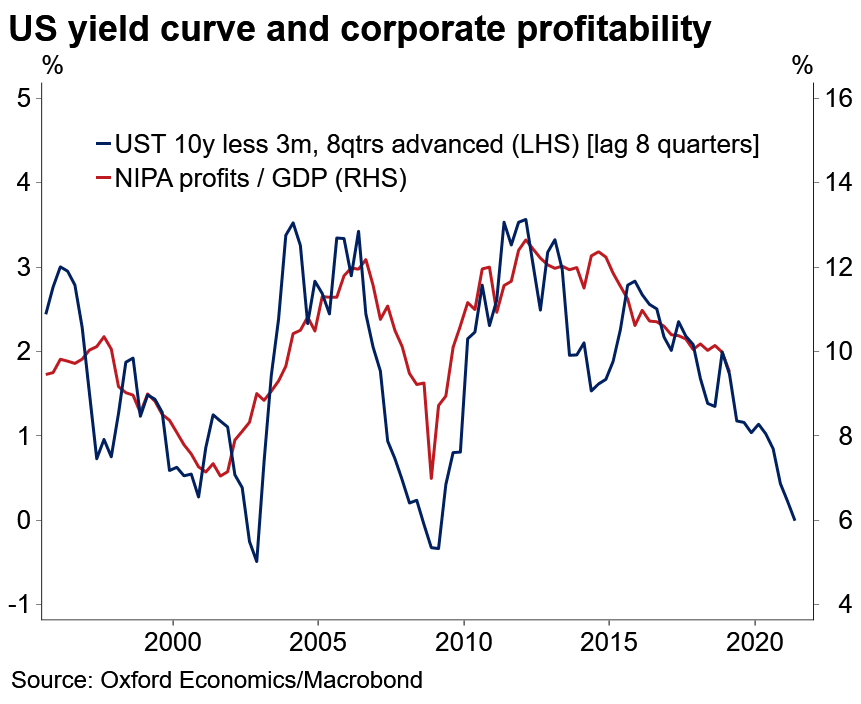
Aug 15 2019 Off U.S. Yield Curve Leads Corporate Profits This chart suggests that the U.S. 10-year less 3-month yield curve leads corporate profits by two years.Image: Oxford Economics, Macrobond