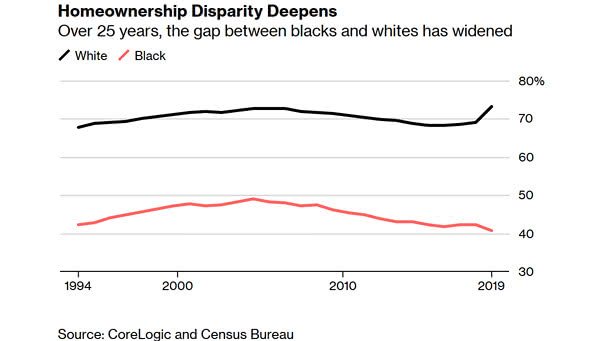
World Population by Region Projected to 2100

World Population by Region Projected to 2100 World population is expected to increase to 10.9 billion by 2100 and 83% of the world population will live in Asia and Africa. Image: Our World in Data

S&P 500 Index – Earnings & Valuation

S&P 500 Index – Earnings & Valuation The S&P 500 valuation is high relative to history and the earnings growth estimate has fallen to +3.7% for 2019. You may also like our “Stock Market Valuation.” Image: Fidelity Investments

Is The U.S. Stock Market Overvalued?

Is The U.S. Stock Market Overvalued? S&P 500 Valuation: the chart shows that the U.S. stock market is not cheap. Based on the forward P/E ratio, the S&P 500 is not extremely overvalued either. You may also like our “Stock Market Valuation.” Image: Bianco Research

How IPOs Are Priced?

How IPOs Are Priced? Great chart showing how IPOs are priced. IPO stands for “It’s Probably Overpriced.” You may also like “IPOs Tend to Underperform the Market.“ Image: Safal Niveshak

The Longest Economic Expansion in American History

The Longest Economic Expansion in American History The U.S. GDP has grown for 121 consecutive months since the Great Recession. This is officially the longest U.S. economic expansion in history.  You may also like “Strength of Economic Expansions.” Image: CNBC

The Top Wealthiest Countries in 2018

The Top Wealthiest Countries in 2018 The United States is the world’s largest wealth market with $60.7 trillion in 2018. Inequality: you may also like “Lower Incomes Paid the Highest Price.” Image: Visual Capitalist

The 10% Richest Households in the U.S. Own Almost 70% of All Wealth

The 10% Richest Households in the U.S. Own Almost 70% of All Wealth The 10% richest households in the US used to own 60% of all wealth. Now they own almost 70%. Inequality: you may also like “U.S. Net Worth by Wealth Bracket.” Image: Deutsche Bank Global Research

Stock Market Forecasting Models vs. US Stock Market

Stock Market Forecasting Models vs. US Stock Market – Growth of $1,000 As an example, the chart shows the growth of $1,000 since 1970, between the stock market forecasting models and the US stock market (compound return before taxes, fees and transactions costs – unleveraged, simulated long & short trades – quarterly basis & logarithmic…

Concentration of Stock Ownership by Wealth Bracket

Concentration of Stock Ownership by Wealth Bracket As the chart shows, the top 20% wealthiest American households own over 93% of stocks. You may also like “How the Composition of Wealth Changes from the Middle Class to The Ultra Rich?” and “U.S. Net Worth by Wealth Bracket.” Image: Visual Capitalist

S&P 500 Valuation – Forward P/E Ratio – May 10, 2019

S&P 500 Valuation – Forward P/E Ratio – May 10, 2019 S&P 500 Valuation: Forward P/E Ratio is 16.5 and equal to the 5-year average, above the 10-Year average (14.7).Based on the forward P/E ratio, the US stock market is not too expensive. You may also like our “Stock Market Valuation.” Image: FactSet Research Systems Inc.

How to Get Inflation?

How to Get Inflation? Mainly, inflation comes from excess money supply growth. There is too much money in the system chasing too few goods and services. Nominal GDP = M x V = P x T M = quantity of money V = velocity of circulation of money P = level of prices T =…