Stock Market Forecasting Models vs. US Stock Market

Stock Market Forecasting Models vs. US Stock Market – Growth of $1,000 As an example, the chart shows the growth of $1,000 since 1970, between the stock market forecasting models and the US stock market (compound return before taxes, fees and transactions costs – unleveraged, simulated long & short trades – quarterly basis & logarithmic…

Concentration of Stock Ownership by Wealth Bracket

Concentration of Stock Ownership by Wealth Bracket As the chart shows, the top 20% wealthiest American households own over 93% of stocks. You may also like “How the Composition of Wealth Changes from the Middle Class to The Ultra Rich?” and “U.S. Net Worth by Wealth Bracket.” Image: Visual Capitalist

S&P 500 Valuation – Forward P/E Ratio – May 10, 2019

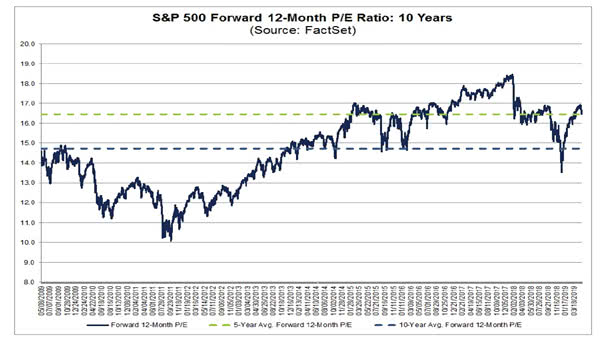
S&P 500 Valuation – Forward P/E Ratio – May 10, 2019 S&P 500 Valuation: Forward P/E Ratio is 16.5 and equal to the 5-year average, above the 10-Year average (14.7).Based on the forward P/E ratio, the US stock market is not too expensive. You may also like our “Stock Market Valuation.” Image: FactSet Research Systems Inc.

How to Get Inflation?

How to Get Inflation? Mainly, inflation comes from excess money supply growth. There is too much money in the system chasing too few goods and services. Nominal GDP = M x V = P x T M = quantity of money V = velocity of circulation of money P = level of prices T =…

Has the United States Ever Imported a Recession from a Single Foreign Country?

Has the United States Ever Imported a Recession from a Single Foreign Country? The biggest U.S. trade partners are: China, Canada, Mexico, Japan, Germany, South Korea, United Kingdom and France. So far, the US has never imported a recession from a single foreign country. A Chinese recession would be bad for the U.S. and the…