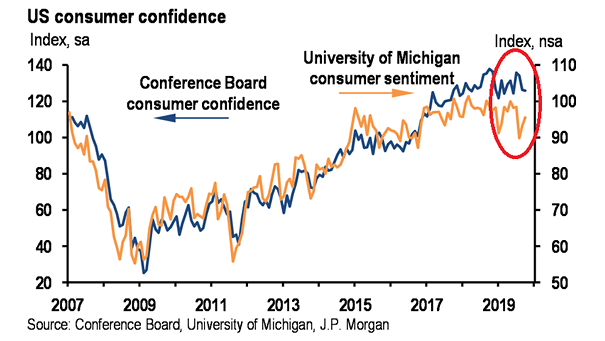
Consumer Sentiment Index and Subsequent 12-Month S&P 500 Returns
Consumer Sentiment Index and Subsequent 12-Month S&P 500 Returns Throughout history, steep declines in consumer sentiment have often been followed by strong stock market rallies over the next year, making these sentiment lows a potentially reliable indicator of upcoming gains. Image: J.P. Morgan Asset Management