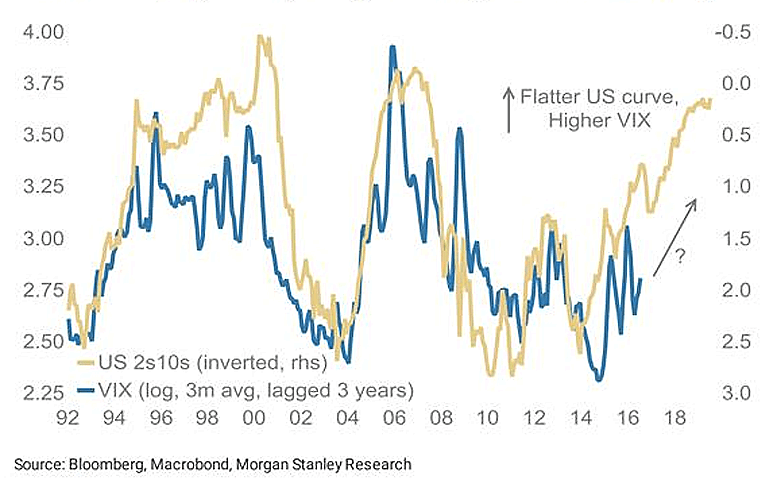
Aug 07 2019 Off The Yield Curve Leads VIX (Volatility) by Three Years Is more volatility expected ahead? This chart suggests that the CBOE Volatility Index or VIX usually follows the U.S. 10-year vs. 2-year Treasury spread (inverted) with a 3-year lag.Image: Morgan Stanley Research