Seasonality – Average of S&P 500 Return Per Calendar Month
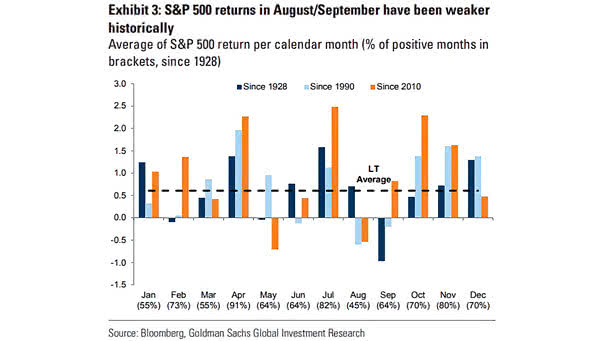
Seasonality – Average of S&P 500 Return Per Calendar Month Historically, August and September have been challenging for the S&P 500. Image: Goldman Sachs Global Investment Research
Seasonality – Average of S&P 500 Return Per Calendar Month Historically, August and September have been challenging for the S&P 500. Image: Goldman Sachs Global Investment Research
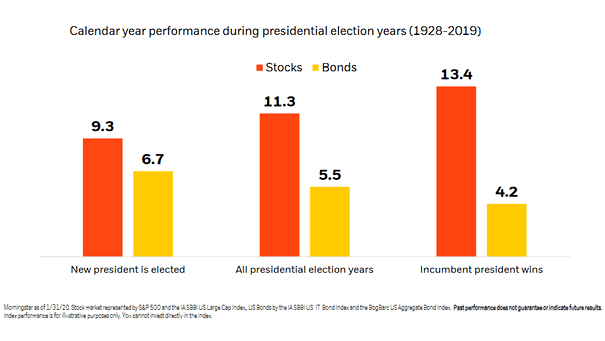
Calendar Year Performance During U.S. Presidential Election Years Presidential election years have historically been good for U.S. equities, when an incumbent president winds up winning reelection. Image: BlackRock Investment Institute

S&P 500 Index Return and Chinese Calendar Year The year of the Pig seems to be strong for U.S. equities this year. Image: Ryan Detrick, LPL Financial LLC
Distribution of Calendar Year Returns: Dow Jones since 1900 The chart shows the calendar year returns on the Dow Jones since 1900, from lowest to highest. It also show that an average return (black bars) does not really exist if we take into account the distribution of calendar year returns since 118 years. Image: Jeroen Blokland
Hyperscaler Capex by Company A once-in-a-generation AI-driven capex boom is reshaping the industry. Hyperscalers are spearheading this change with massive investments in AI infrastructure, with spending set to reach $330 billion in 2025. Image: Goldman Sachs Global Investment Research
S&P 500 January-January Price % Changes during Years Associated with Chinese Lunar New Years since 1900 2020 is the year of the rat by the Chinese lunar calendar. This chart shows S&P 500 returns during each of the Chinese lunar years. Image: CFRA, S&P Global
S&P 500 Largest Pullbacks in the First Five Months of Each Year Over the last 50 years, the S&P 500 has performed the first five months of the year without a decline of at least a 2.5% pullback only once in 1995. Is a pullback for U.S. stocks approaching? Image: J.P. Morgan See S&P 500 Intra-Year…