VIX Level and S&P 500 New Highs
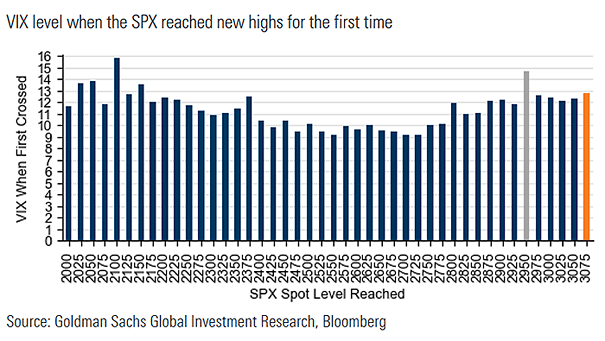
VIX Level and S&P 500 New Highs The VIX level when the S&P 500 reached new highs for the first time is rising. Image: Goldman Sachs Global Investment Research
VIX Level and S&P 500 New Highs The VIX level when the S&P 500 reached new highs for the first time is rising. Image: Goldman Sachs Global Investment Research
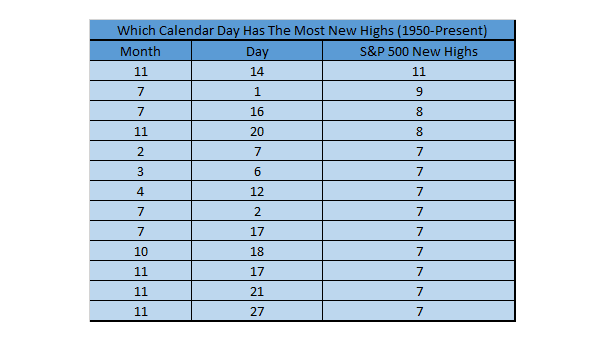
S&P 500 New Highs Since 1950, November 14 has the most S&P 500 new highs ever at 11. Image: Ryan Detrick, LPL Financial LLC

S&P 500 Index Returns After Fed Rate Cuts Near New Highs The adage of “don’t fight the Fed” may be too simplistic, but usually, the market doesn’t care too much about other things, as long as the Fed stays dovish. Image: LPL Research
New S&P 500 Index All-Time Highs Per Year The S&P 500 notched its ninth record high of 2025 yesterday, marking its 1,250th all-time high since 1957—a milestone that reflects the index’s steady long-term growth! Image: Carson Investment Research
S&P 500 Returns After New All-Time Highs Since 1990, despite periods of volatility, the S&P 500 has typically continued rising after new all-time highs, with a median 12-month gain of 13.5% and positive returns more than 82% of the time. Image: Carson Investment Research
S&P 500 Performance After >58% of Components Make a New 20-Day High More good news for bulls: Since 1976, the S&P 500 has gained an average of 18.7% in the 12 months after more than 58% of its components hit a 20-day high, with positive returns every single time. Image: Carson Investment Research
% of Days per Year to Make a New All-Time High for the S&P 500 The S&P 500’s performance this year reflects a strong bullish trend, with over one-fifth of trading days achieving new all-time highs, underscoring a favorable market environment. Image: Carson Investment Research
S&P 500 and New 52-Week Highs and New 52-Week Lows The improvement in the percentage of S&P 500 stocks at new 52-week highs can be seen as a confirmation of a cyclical bull market. This indicates positive market sentiment and a potential upward trend for stocks. Image: BofA Global Research
S&P 500 Performance After New All-Time Highs On All Five Days of the Week When the S&P 500 hits new all-time highs on all five days of the week, historical data suggests a bullish outlook over the next 12 months, with a median return of 8.7% since 1950. Image: Carson Investment Research
S&P 500 Number of Consecutive Days Without Reaching New All-Time High While reaching all-time highs can present opportunities, investors sometimes have to wait a very long time before the S&P 500 reaches a new all-time high. Image: Topdown Charts
S&P 500 Performance After 118 or More New 52-Week Highs 118 new 52-week highs for the S&P 500 (using first signal in 6 months) suggest a bullish outlook over the next 12 months, with an average gain of 12% since 1950. Image: Carson Investment Research