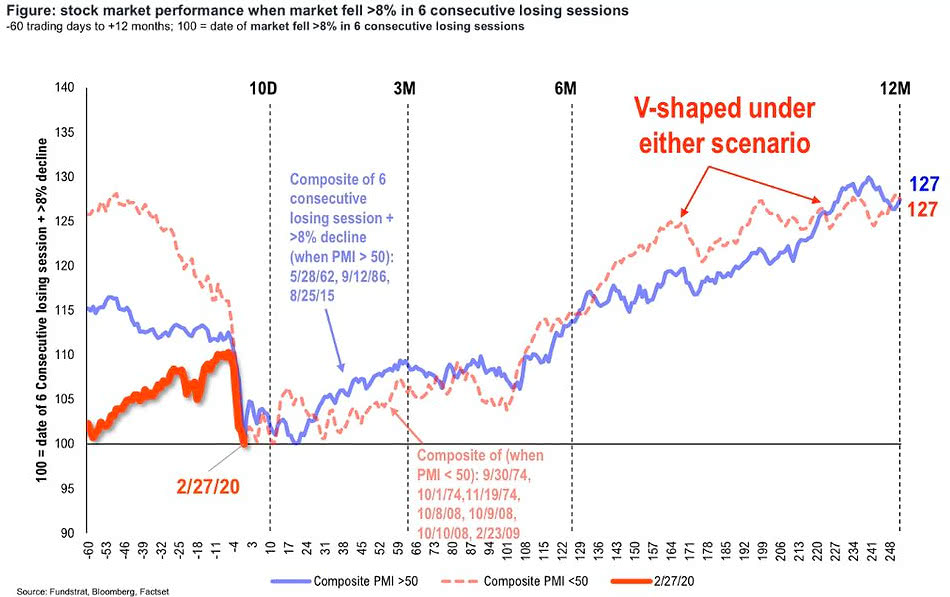
Feb 29 2020 Off U.S. Stock Market Performance When Market Fell > 8% in 6 Consecutive Losing Sessions This chart shows the U.S. stock market performance since 1948, when the market fell more than 8% in 6 consecutive losing sessions, with PMI > 50 and PMI < 50.Image: Fundstrat Global Advisors, LLC