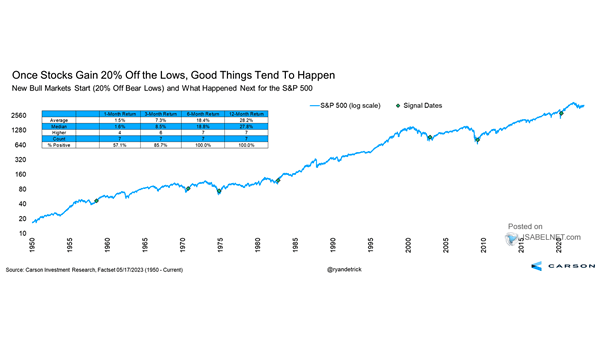
Bull Markets After Initial Fed Rate Hike
Bull Markets After Initial Fed Rate Hike Historically, the first Fed rate hike is not the end of the bull market. Image: LPL Research
Bull Market – S&P 500 % Returns and Length of 50-Trading Day Breakouts Can the S&P 500 continue to rise? Image: Arbor Research & Trading LLC
Number of Trading Days for Each S&P 500 Bull Market to Double Since WWII, this is the fastest bull market to double off a bottom. Image: CNBC
S&P 500 Uninterrupted Bull Markets Without -10% Swing Down Since 1950, there has been an average of one 10% correction per year for the S&P 500 Index. Image: Nautilus Research
Bull Markets – S&P 500 Performance in Year 1 and Year 2 Off Low and Second Year Max Drawdown Since 1950, the S&P 500 gain during the second year of bull markets has been about 13% on average. Image: LPL Research
S&P 500 – Second Year of Bull Markets The second year of bull markets tends to be strong, but a choppy market could be on the horizon. Image: LPL Research
S&P 500 Pullbacks During Year Two of Bull Markets Should investors wait for a pullback as an opportunity to invest in U.S. stocks? Image: Axios
Bull Market Analogs – 2020 vs. 2009 Will the current bull market continue to track the bull market of 2009? Image: Fidelity Investments
The S&P 500 from the 1950, 1980 and 2013 Secular Bull Market Breakout Points Should investors expect the S&P 500 to hit 4600-4900 into late 2021 to early 2022? Image: BofA Global Research Click the Image to Enlarge
S&P 500 Index Bull Markets after the Trough After a historic rally of 89% for the S&P 500, the current bull market is still tracking the bull market of 2009. Image: LPL Research