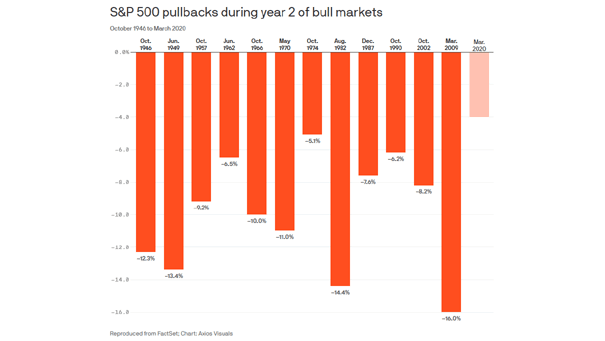
S&P 500 Pullbacks During Year Two of Bull Markets
S&P 500 Pullbacks During Year Two of Bull Markets Should investors wait for a pullback as an opportunity to invest in U.S. stocks? Image: Axios
S&P 500 Pullbacks During Year Two of Bull Markets Should investors wait for a pullback as an opportunity to invest in U.S. stocks? Image: Axios
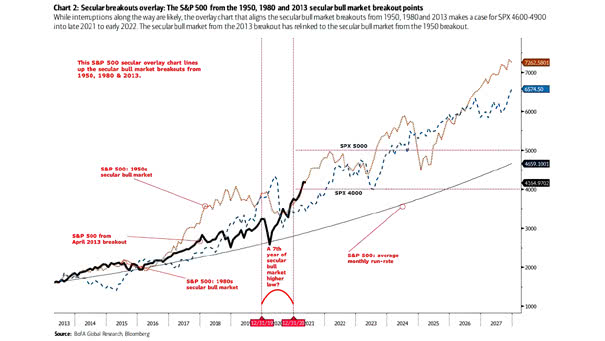
The S&P 500 from the 1950, 1980 and 2013 Secular Bull Market Breakout Points Should investors expect the S&P 500 to hit 4600-4900 into late 2021 to early 2022? Image: BofA Global Research Click the Image to Enlarge

S&P 500 Index Bull Markets after the Trough After a historic rally of 89% for the S&P 500, the current bull market is still tracking the bull market of 2009. Image: LPL Research
Bull Market – S&P 500 Index Performance Following >30% Bear Market Bottoms Historically, the S&P 500 has been up the second year of a new bull market every single time. Image: LPL Research
S&P 500 Index Bull Markets (Since WWII) The First Year and the Second Year Historically, the S&P 500 Index tends to add gains in year two of bull markets. Image: LPL Research
Bull Market – IG + Tech Fund Flows and S&P 500 What will end the current bull market? Image: BofA Global Investment Strategy
S&P 500 Bull Market Rally – 1929 vs. 2020 Should investors expect a market similar to that of 1929 going forward? Image: BofA Global Investment Strategy
S&P 500 Index Bull Markets (Since WWII) the First Year So far, the new bull maket is topping all other bull markets since WWII. Image: LPL Research
U.S. Bull Markets Throughout History The new bull market was confirmed this week, and it’s already almost 5 months old. Image: CNBC
Secular Bull Market – Dow Jones Industrial Average and 30-Year Bond Cycles Chart suggesting a “new” secular bull market underway with the potential to last until 2034. Image: Fundstrat Global Advisors, LLC
FMS Investors and Bull Market Net 46% of FMS investors say “it is a bull market”, no longer a “bear market rally” (35%). Image: BofA Global Fund Manager Survey