Inflation – Cost of Shipping Goods from China
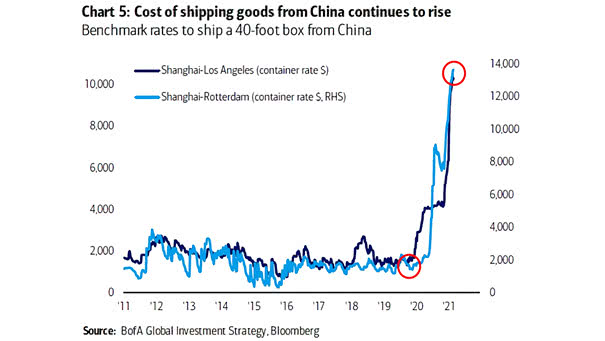
Inflation – Cost of Shipping Goods from China Container rates from China are rocketing higher. Image: BofA Global Investment Strategy
Inflation – Cost of Shipping Goods from China Container rates from China are rocketing higher. Image: BofA Global Investment Strategy
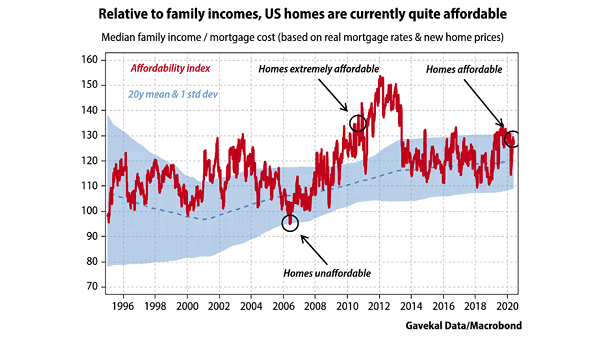
Housing – U.S. Median Famility Income to Mortgage Cost This chart suggests that relative to family incomes, buying a home in the U.S. is currently quite affordable by historical standards. Image: Gavekal, Macrobond

U.S. Stocks – The Cost of Market Timing This chart shows the impact on performance over time, when investors attempt to time the market. Image: Legg Mason
Inflation – The Rising Cost of U.S. Education and Health Care The costs of health care and education have risen faster than other goods. Image: Gavekal, Macrobond
The Cost of a Comfortable Living in the United States This map shows how long Americans need to work to enjoy a comfortable life. Image: howmuch.net Click the Image to Enlarge
S&P 500 Industrials Index and U.S. Manufacturing Unit Labor Costs When U.S. labor costs rise, industrial profit margins are under pressure. Image: Quill Intelligence, LLC
Projected U.S. Health Care Costs Over the next 10 years, the federal government is expected to spend $16 trillion on health care and $6 trillion on interest costs. Image: Deutsche Bank Global Research
U.S. Health Care Costs U.S. health care costs have skyrocketed and are higher than in any other country Image: Deutsche Bank Global Research
How Much Tariffs Could Cost Each State? This chart shows how much each state would be affected by China’s export tariffs. Image: howmuch.net
Labor Costs Lead Core Inflation by 6 Months Historically, U.S. labor costs have been a good leading indicator of core inflation, because when labor costs rise, companies tend to increase their prices. Image: Legg Mason
Oil Prices and Events Higher oil prices act like a tax on the economy, cutting disposable income and raising business costs, which can slow growth or cause recessions. However, these spikes are generally short-lived because demand falls and markets adapt. Image: Real Investment Advice